
Cross-over levelling: trend vs wavelength based#
[1]:
%load_ext autoreload
%autoreload 2


import logging

import matplotlib.pyplot as plt
import numpy as np
import pandas as pd
import plotly.io as pio
import verde as vd

import airbornegeo

# setup logging to get some additional info from the airbornegeo functions
logging.getLogger("airbornegeo").setLevel("INFO")
logging.basicConfig()
pio.renderers.default = "notebook"
Load data#
This notebook uses the data and intersections dataframes from the previous notebook Cross-over-errors.
[2]:
data_df = pd.read_csv("data/AGAP_magnetic_survey_processed_blocked.csv")
data_df = data_df[
    [
        "easting",
        "northing",
        "height",
        "line",
        "unixtime",
        "distance_along_line",
        "mag",
    ]
]

# define flight lines vs tie lines
data_df["line_type"] = np.where(data_df.line >= 142, 1, 0)

data_df = data_df.rename(columns={"distance_along_line": "along_line_distance"})

# keep a subset of tie lines and just 1 flight line
line = 77
lines_to_keep = [
    150,
    151,
    152,
    153,
    154,
    155,
    156,
    157,
    158,
    159,
    160,
    161,
    162,
    164,
    165,
    166,
    167,
]
lines_to_keep = np.append(lines_to_keep, line)

data_df = data_df[(data_df.line.isin(lines_to_keep))]

data_df.head()
[2]:
| easting | northing | height | line | unixtime | along_line_distance | mag | line_type | |
|---|---|---|---|---|---|---|---|---|
| 155245 | 613796.184341 | 108259.149034 | 3793.1 | 77 | 1.230970e+09 | 72.986528 | 35.54 | 0 |
| 155246 | 614014.105815 | 108288.966298 | 3791.7 | 77 | 1.230970e+09 | 292.943124 | 35.18 | 0 |
| 155247 | 614232.757811 | 108315.269624 | 3791.9 | 77 | 1.230970e+09 | 513.172378 | 34.43 | 0 |
| 155248 | 614414.514181 | 108337.253486 | 3793.5 | 77 | 1.230970e+09 | 696.255616 | 33.60 | 0 |
| 155249 | 614594.969358 | 108363.481597 | 3794.7 | 77 | 1.230970e+09 | 878.614978 | 32.61 | 0 |
[3]:
vmin, vmax = vd.minmax(data_df.mag, min_percentile=5, max_percentile=95)
ax = data_df[::10].plot.scatter(
    "easting",
    "northing",
    c="mag",
    s=1,
    cmap="viridis",
    vmin=vmin,
    vmax=vmax,
    title="Unlevelled data",
)
ax.set_aspect("equal")
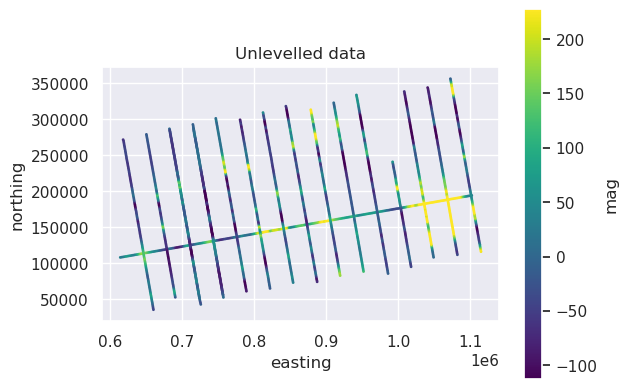
[ ]:
# Create Survey object with data and column bindings
survey = airbornegeo.Survey(
    data_df,
    line_column="line",
    line_type_column="line_type",
    distance_column="along_line_distance",
)

# calculate theoretical intersection points
survey.create_intersection_table(method="groups")

# interpolate mag data at intersections
survey.interpolate_intersections(
    to_interp="mag",
    window_width=500,
    method="cubic",
    extrapolate=False,
)

# calculate cross-over errors
survey.calculate_crossover_errors(data_col="mag")

# Capture baseline inters for branching (forked intersection pattern)
inters = survey.intersections
[ ]:
survey.plot_line_and_crosses(
    y=["mag"], x="along_line_distance", line=line, y_axes=[1], plot_inters=True
)
[ ]:
survey.intersections.plot.scatter(
    "dist_along_line1",
    "crossover_error_0",
    marker="^",
    s=30,
    c="r",
    # ax=axs,
    label="mistie values",
)
Level with fitting a trend to the cross-overs#
By fitting a trend to the mistie values, we can create levelling correction values to add to the entire line. For this, we can choose the order of the trend. A trend order of 0 results in a vertical shift, a trend order of 1 results in tilting line, and a trend of order 2 gives a polynomial.
[ ]:
# Level with trend degree 0 - reset to baseline for independent branch
survey.intersections = inters
survey.crossover_pair_levelling(
    lines_to_level=[line],
    data_col="mag",
    levelled_col="mag_levelled_trend0",
    degree=0,
)

# calculate levelling correction
survey.data["levelling_correction_trend0"] = (
    survey.data.mag - survey.data.mag_levelled_trend0
)
[ ]:
# Level with trend degree 1 - reset to baseline for independent branch
survey.intersections = inters
survey.crossover_pair_levelling(
    lines_to_level=[line],
    data_col="mag",
    levelled_col="mag_levelled_trend1",
    degree=1,
)

# calculate levelling correction
survey.data["levelling_correction_trend1"] = (
    survey.data.mag - survey.data.mag_levelled_trend1
)
[ ]:
# Level with trend degree 2 - reset to baseline for independent branch
survey.intersections = inters
survey.crossover_pair_levelling(
    lines_to_level=[line],
    data_col="mag",
    levelled_col="mag_levelled_trend2",
    degree=2,
)

# calculate levelling correction
survey.data["levelling_correction_trend2"] = (
    survey.data.mag - survey.data.mag_levelled_trend2
)
[ ]:
fig, axs = plt.subplots(1, 1, figsize=(10, 5))

ax = survey.intersections.plot.scatter(
    "dist_along_line1",
    "crossover_error_0",
    marker="^",
    s=30,
    c="r",
    ax=axs,
    label="mistie values",
)

ax = survey.data[survey.data.line == line].plot.scatter(
    "along_line_distance",
    "levelling_correction_trend0",
    s=0.2,
    c="g",
    ax=axs,
    label="Levelling correction trend 0",
)
ax = survey.data[survey.data.line == line].plot.scatter(
    "along_line_distance",
    "levelling_correction_trend1",
    s=0.2,
    c="purple",
    ax=axs,
    label="Levelling correction trend 1",
)
ax = survey.data[survey.data.line == line].plot.scatter(
    "along_line_distance",
    "levelling_correction_trend2",
    s=0.2,
    c="b",
    ax=axs,
    label="Levelling correction trend 2",
)
ax.set_ylabel("nT")
ax.legend(markerscale=2)
plt.show()
Wavelength-based levelling#
In the above cells, we calculate cross-over errors, and fit trends of specified orders to these values, yielding a levelling correction.
An alternative method is to interpolate these cross-over errors along the entire line and low-pass filter the results. This means we can choose the wavelength of our levelling correction, and our levelling corrections are independent of line length.
[ ]:
# Wavelength-based levelling with 100km filter - reset to baseline for independent branch
survey.intersections = inters
survey.crossover_pair_levelling(
    lines_to_level=[line],
    data_col="mag",
    levelled_col="mag_levelled_filter",
    filter_type="g100000",
)

# calculate levelling correction
survey.data["levelling_correction_100km_filter"] = (
    survey.data.mag - survey.data.mag_levelled_filter
)
[ ]:
# Wavelength-based levelling with 500km filter - reset to baseline for independent branch
survey.intersections = inters
survey.crossover_pair_levelling(
    lines_to_level=[line],
    data_col="mag",
    levelled_col="mag_levelled_filter",
    filter_type="g500000",
)

# calculate levelling correction
survey.data["levelling_correction_500km_filter"] = (
    survey.data.mag - survey.data.mag_levelled_filter
)
[ ]:
# Wavelength-based levelling with 500km filter (repeated) - reset to baseline for independent branch
survey.intersections = inters
survey.crossover_pair_levelling(
    lines_to_level=[line],
    data_col="mag",
    levelled_col="mag_levelled_filter",
    filter_type="g500000",
)

# calculate levelling correction
survey.data["levelling_correction_500km_filter"] = (
    survey.data.mag - survey.data.mag_levelled_filter
)
[ ]:
# Wavelength-based levelling with 1000km filter - reset to baseline for independent branch
survey.intersections = inters
survey.crossover_pair_levelling(
    lines_to_level=[line],
    data_col="mag",
    levelled_col="mag_levelled_filter",
    filter_type="g1000000",
)

# calculate levelling correction
survey.data["levelling_correction_1000km_filter"] = (
    survey.data.mag - survey.data.mag_levelled_filter
)
[ ]:
fig, axs = plt.subplots(1, 1, figsize=(10, 5))


ax = survey.intersections.plot.scatter(
    "dist_along_line1",
    "crossover_error_0",
    marker="^",
    s=30,
    c="r",
    ax=axs,
    label="mistie values",
)
ax = survey.data[survey.data.line == line].plot.scatter(
    "along_line_distance",
    "levelling_correction_100km_filter",
    s=0.2,
    c="g",
    ax=axs,
    label="Levelling correction 100 km filter",
)
ax = survey.data[survey.data.line == line].plot.scatter(
    "along_line_distance",
    "levelling_correction_500km_filter",
    s=0.2,
    c="purple",
    ax=axs,
    label="Levelling correction 500 km filter",
)
ax = survey.data[survey.data.line == line].plot.scatter(
    "along_line_distance",
    "levelling_correction_1000km_filter",
    s=0.2,
    c="b",
    ax=axs,
    label="Levelling correction 1000 km filter",
)
ax.set_ylabel("nT")
ax.legend(markerscale=2)
plt.show()
[ ]: