1. Reproject data#
Many of the functions in airbornegeo require coordiantes in meters. We can use the function reproject to convert from geographic coordinates (latitude/longitude) to projected coordinates (meters east/north), or between two different projected coordinates reference systems.
[ ]:
# %load_ext autoreload
# %autoreload 2

import pandas as pd

import airbornegeo
[19]:
data_df = pd.read_csv("data/AGAP_magnetic_survey_processed_blocked.csv")
data_df = data_df[["longitude", "latitude", "mag_levelled", "line", "unixtime"]]
# for speed only retain every 100th point
data_df = data_df[::100]
data_df
[19]:
| longitude | latitude | mag_levelled | line | unixtime | |
|---|---|---|---|---|---|
| 0 | 75.635869 | -84.104145 | -22.68 | 1 | 1.229500e+09 |
| 100 | 75.709950 | -84.011406 | -76.28 | 1 | 1.229501e+09 |
| 200 | 75.771279 | -83.919180 | -63.65 | 1 | 1.229501e+09 |
| 300 | 75.838380 | -83.826748 | -59.30 | 1 | 1.229501e+09 |
| 400 | 75.933132 | -83.736291 | -47.00 | 1 | 1.229501e+09 |
| ... | ... | ... | ... | ... | ... |
| 703400 | 86.134851 | -79.979512 | -138.95 | 206 | 1.231249e+09 |
| 703500 | 85.611921 | -79.988901 | -104.12 | 206 | 1.231249e+09 |
| 703600 | 85.089819 | -79.997240 | -139.69 | 206 | 1.231249e+09 |
| 703700 | 84.565945 | -80.004750 | 0.63 | 206 | 1.231249e+09 |
| 703800 | 84.037875 | -80.011449 | -45.44 | 206 | 1.231249e+09 |
7039 rows × 5 columns
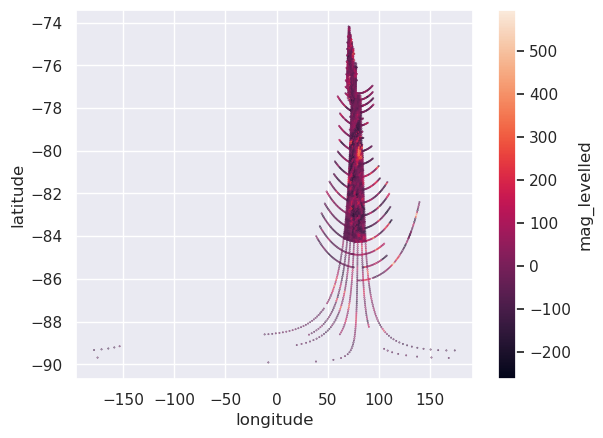
1.1. Plot the data in projected units#
[20]:
ax = data_df.plot.scatter(
    "longitude",
    "latitude",
    c="mag_levelled",
    s=0.1,
)
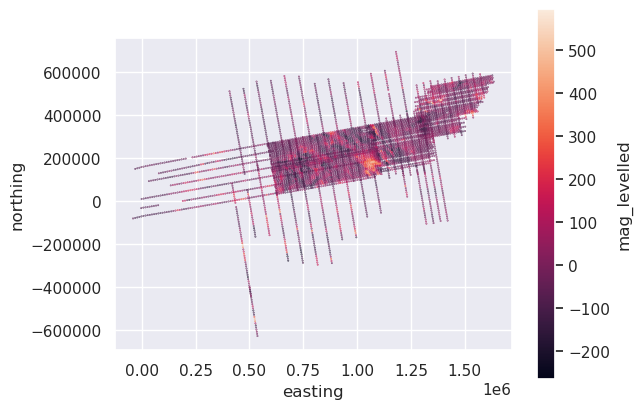
1.2. Reproject#
Since the original data is in lat / lon, the input CRS will be EPSG:4326, and we can reproject the data to EPSG 3031 - South Polar Stereographic, since the data is located in Antarctica.
[21]:
data_df["easting"], data_df["northing"] = airbornegeo.reproject(
    data_df.longitude,
    data_df.latitude,
    input_crs="EPSG:4326",
    output_crs="EPSG:3031",
)
data_df.head()
[21]:
| longitude | latitude | mag_levelled | line | unixtime | easting | northing | |
|---|---|---|---|---|---|---|---|
| 0 | 75.635869 | -84.104145 | -22.68 | 1 | 1.229500e+09 | 621099.093961 | 159056.748316 |
| 100 | 75.709950 | -84.011406 | -76.28 | 1 | 1.229501e+09 | 631094.016262 | 160747.130253 |
| 200 | 75.771279 | -83.919180 | -63.65 | 1 | 1.229501e+09 | 641004.786667 | 162541.084172 |
| 300 | 75.838380 | -83.826748 | -59.30 | 1 | 1.229501e+09 | 650959.222827 | 164254.115346 |
| 400 | 75.933132 | -83.736291 | -47.00 | 1 | 1.229501e+09 | 660790.608773 | 165572.968737 |
[23]:
ax = data_df.plot.scatter(
    "easting",
    "northing",
    c="mag_levelled",
    s=0.1,
)
ax.set_aspect("equal")