7. Assessing levelling results#
[1]:
# %load_ext autoreload
# %autoreload 2
import logging
import geopandas as gpd
import harmonica as hm
import numpy as np
import pandas as pd
import plotly.io as pio
import polartoolkit as ptk
import verde as vd
import airbornegeo
# setup logging to get some additional info from the airbornegeo functions
logging.getLogger("airbornegeo").setLevel("INFO")
logging.basicConfig()
pio.renderers.default = "notebook"
/home/sungw937/airbornegeo/.pixi/envs/default/lib/python3.14/site-packages/tqdm/auto.py:21: TqdmWarning: IProgress not found. Please update jupyter and ipywidgets. See https://ipywidgets.readthedocs.io/en/stable/user_install.html
from .autonotebook import tqdm as notebook_tqdm
7.1. Load data#
This is a subset of the BAS AGAP survey over Antarctica’s Gamburtsev Subglacial Mountains. The file is download and subset in the notebook AGAP_magnetic_survey, and the BAS processing steps are repeated in the notebook processing_AGAP_magnetic_survey.
[2]:
data_df = pd.read_csv("data/AGAP_magnetic_survey_processed_blocked.csv")
data_df = data_df[
[
"easting",
"northing",
"height",
"line",
"unixtime",
"distance_along_line",
"mag",
]
]
# to run faster, limit number of lines
data_df = data_df[~data_df.line.between(133, 142)]
data_df = data_df[~data_df.line.between(168, 176)]
data_df = data_df[
(data_df.line.isin(data_df.line.unique()[::2])) | (data_df.line >= 143)
]
# define flight lines vs tie lines with column 'tie' which is True or False
data_df["tie"] = False
data_df.loc[data_df.line >= 142, "tie"] = True
# convert dataframe into geodataframe
data_df = gpd.GeoDataFrame(
data_df,
geometry=gpd.points_from_xy(data_df.easting, data_df.northing),
crs="EPSG:3031",
)
data_df
[2]:
| easting | northing | height | line | unixtime | distance_along_line | mag | tie | geometry | |
|---|---|---|---|---|---|---|---|---|---|
| 0 | 6.210991e+05 | 159056.748193 | 4110.45 | 1 | 1.229500e+09 | 27.181565 | -33.385 | False | POINT (621099.094 159056.748) |
| 1 | 6.212065e+05 | 159071.301512 | 4114.50 | 1 | 1.229500e+09 | 135.587530 | -35.120 | False | POINT (621206.518 159071.302) |
| 2 | 6.213138e+05 | 159085.113599 | 4117.90 | 1 | 1.229500e+09 | 243.749367 | -36.875 | False | POINT (621313.794 159085.114) |
| 3 | 6.214207e+05 | 159099.184618 | 4120.80 | 1 | 1.229500e+09 | 351.600337 | -38.585 | False | POINT (621420.723 159099.185) |
| 4 | 6.215272e+05 | 159114.303863 | 4123.15 | 1 | 1.229500e+09 | 459.104857 | -40.205 | False | POINT (621527.158 159114.304) |
| ... | ... | ... | ... | ... | ... | ... | ... | ... | ... |
| 703796 | 1.082115e+06 | 112573.528454 | 4191.50 | 206 | 1.231249e+09 | 177936.928871 | -27.040 | True | POINT (1082115.451 112573.528) |
| 703797 | 1.082103e+06 | 112648.360155 | 4191.60 | 206 | 1.231249e+09 | 178012.800558 | -28.040 | True | POINT (1082102.932 112648.36) |
| 703798 | 1.082084e+06 | 112760.548617 | 4191.80 | 206 | 1.231249e+09 | 178126.596403 | -29.410 | True | POINT (1082083.873 112760.549) |
| 703799 | 1.082065e+06 | 112872.636385 | 4192.30 | 206 | 1.231249e+09 | 178240.329983 | -30.840 | True | POINT (1082064.595 112872.636) |
| 703800 | 1.082042e+06 | 113004.019427 | 4193.40 | 206 | 1.231249e+09 | 178373.722649 | -40.840 | True | POINT (1082041.528 113004.019) |
399208 rows × 9 columns
7.2. Find intersections#
[3]:
# convert dataframe into geodataframe
data_df = gpd.GeoDataFrame(
data_df,
geometry=gpd.points_from_xy(data_df.easting, data_df.northing),
crs="EPSG:3031",
)
[4]:
# calculate theoretical intersection points
inters = airbornegeo.create_intersection_table(
data_df,
plot_map=False,
plot_hist=False,
)
inters
Line/tie combinations: 100%|██████████| 3630/3630 [00:00<00:00, 3703.45it/s]
Potential intersections: 100%|██████████| 670/670 [00:12<00:00, 52.95it/s]
INFO:airbornegeo:found 662 intersections
[4]:
| line | tie | geometry | max_dist | easting | northing | |
|---|---|---|---|---|---|---|
| 0 | 1 | 143 | POINT (1158153 254083) | 16.441255 | 1158153.0 | 254083.0 |
| 1 | 1 | 144 | POINT (1190820 259865) | 24.124887 | 1190820.0 | 259865.0 |
| 2 | 1 | 145 | POINT (1223524 265689) | 17.269650 | 1223524.0 | 265689.0 |
| 3 | 1 | 146 | POINT (1256193 271497) | 31.608179 | 1256193.0 | 271497.0 |
| 4 | 1 | 147 | POINT (1288901 277249) | 50.174377 | 1288901.0 | 277249.0 |
| ... | ... | ... | ... | ... | ... | ... |
| 657 | 125 | 199 | POINT (1318165 302398) | 33.689493 | 1318165.0 | 302398.0 |
| 658 | 125 | 200 | POINT (1350929 308239) | 36.343660 | 1350929.0 | 308239.0 |
| 659 | 127 | 148 | POINT (1319894 292699) | 22.093103 | 1319894.0 | 292699.0 |
| 660 | 127 | 199 | POINT (1319922 292702) | 23.297236 | 1319922.0 | 292702.0 |
| 661 | 127 | 200 | POINT (1352642 298507) | 36.743873 | 1352642.0 | 298507.0 |
662 rows × 6 columns
7.3. Add intersections as rows to the dataframe#
[5]:
data_df, inters = airbornegeo.interpolate_intersections(
data_df,
inters,
to_interp="mag",
window_width=500,
method="cubic",
extrapolate=False,
)
Segments: 100%|██████████| 121/121 [00:08<00:00, 13.82it/s]
[6]:
lines_without_inters = airbornegeo.lines_without_intersections(data_df, inters)
lines_without_inters
[6]:
[np.int64(107),
np.int64(109),
np.int64(129),
np.int64(131),
np.int64(188),
np.int64(189),
np.int64(190),
np.int64(192),
np.int64(193),
np.int64(194),
np.int64(203)]
[7]:
# drop lines without intersections
data_df = data_df[~data_df.line.isin(lines_without_inters)]
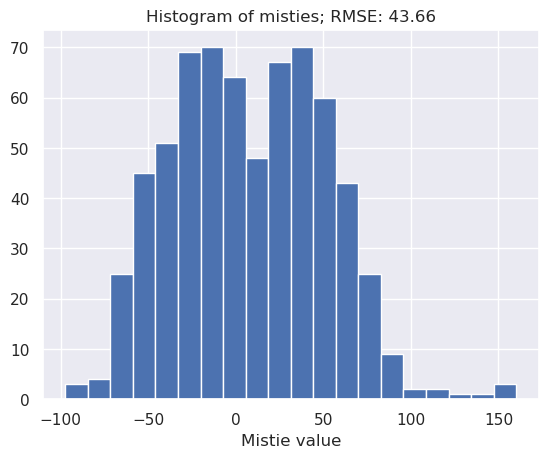
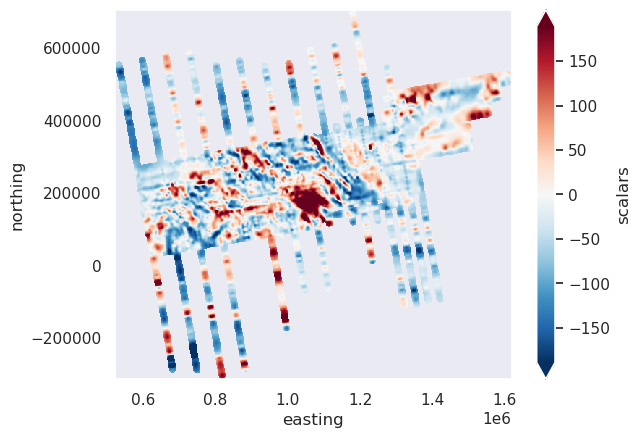
7.4. Calculate initial cross-over errors#
[8]:
inters = airbornegeo.calculate_crossover_errors(
data_df,
inters,
data_col="mag",
plot_map=True,
)
[9]:
inters.head()
[9]:
| line | tie | geometry | max_dist | easting | northing | dist_along_flight_line | dist_along_flight_tie | flight_interpolation_type | tie_interpolation_type | mistie_0 | |
|---|---|---|---|---|---|---|---|---|---|---|---|
| 0 | 1 | 143 | POINT (1158153 254083) | 16.441255 | 1158153.0 | 254083.0 | 545768.072695 | 138071.419338 | interpolated | interpolated | 100.458661 |
| 1 | 1 | 144 | POINT (1190820 259865) | 24.124887 | 1190820.0 | 259865.0 | 578952.394781 | 131585.125284 | interpolated | interpolated | 32.151483 |
| 2 | 1 | 145 | POINT (1223524 265689) | 17.269650 | 1223524.0 | 265689.0 | 612181.972720 | 147253.496664 | interpolated | interpolated | 72.936553 |
| 3 | 1 | 146 | POINT (1256193 271497) | 31.608179 | 1256193.0 | 271497.0 | 645372.035087 | 136211.666619 | interpolated | interpolated | 84.125118 |
| 4 | 1 | 147 | POINT (1288901 277249) | 50.174377 | 1288901.0 | 277249.0 | 678598.170740 | 155115.224990 | interpolated | interpolated | -7.731396 |
7.5. Grid the pre-levelled data#
[10]:
# block reduce the line data
data_df_blocked = airbornegeo.block_reduce(
data_df,
np.median,
spacing=2000,
reduce_by="distance_along_line",
groupby_column="line",
)
data_df_blocked = data_df_blocked.dropna(
subset=["easting", "northing", "height", "mag"]
)
data_df_blocked.describe()
Segments: 100%|██████████| 110/110 [00:13<00:00, 8.05it/s]
[10]:
| distance_along_line | easting | northing | height | unixtime | mag | intersecting_line | line | |
|---|---|---|---|---|---|---|---|---|
| count | 17035.000000 | 1.703500e+04 | 17035.000000 | 17035.000000 | 1.703500e+04 | 17035.000000 | 0.0 | 17035.000000 |
| mean | 190709.344148 | 1.016368e+06 | 237459.984304 | 3858.220164 | 1.230897e+09 | -12.277979 | NaN | 97.929557 |
| std | 136541.851428 | 2.600426e+05 | 149691.744103 | 445.557159 | 6.576276e+05 | 88.700010 | NaN | 62.661673 |
| min | 906.587566 | 5.328906e+05 | -302813.880978 | 2478.275000 | 1.229500e+09 | -362.340000 | NaN | 1.000000 |
| 25% | 83114.751614 | 7.884050e+05 | 150079.397459 | 3615.325000 | 1.230456e+09 | -65.795000 | NaN | 49.000000 |
| 50% | 168802.572822 | 1.004641e+06 | 236056.988635 | 4004.925000 | 1.230996e+09 | -22.175000 | NaN | 85.000000 |
| 75% | 264878.758596 | 1.239572e+06 | 329857.396073 | 4194.350000 | 1.231484e+09 | 27.547500 | NaN | 156.000000 |
| max | 742790.403584 | 1.609834e+06 | 695692.176078 | 4495.200000 | 1.232150e+09 | 847.370000 | NaN | 206.000000 |
[11]:
coords = (
data_df_blocked.easting,
data_df_blocked.northing,
data_df_blocked.height,
)
eqs_unlevelled = hm.EquivalentSources(damping=0.1, depth="default", block_size=2000)
eqs_unlevelled.fit(coords, data_df_blocked.mag)
[11]:
EquivalentSources(block_size=2000, damping=0.1)In a Jupyter environment, please rerun this cell to show the HTML representation or trust the notebook.
On GitHub, the HTML representation is unable to render, please try loading this page with nbviewer.org.
Parameters
| damping | 0.1 | |
| points | None | |
| depth | 'default' | |
| block_size | 2000 | |
| parallel | True | |
| dtype | 'float64' |
[12]:
# Define grid coordinates
grid_coords = vd.grid_coordinates(
region=vd.pad_region(vd.get_region(coords), 10e3),
spacing=2000,
extra_coords=4200, # upward continue
adjust="region",
)
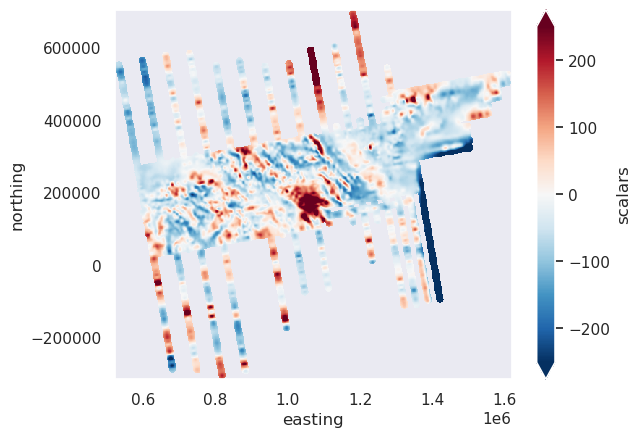
grid_unlevelled = eqs_unlevelled.grid(grid_coords)
grid_unlevelled = vd.distance_mask(
(coords[0], coords[1]), maxdist=10e3, grid=grid_unlevelled
)
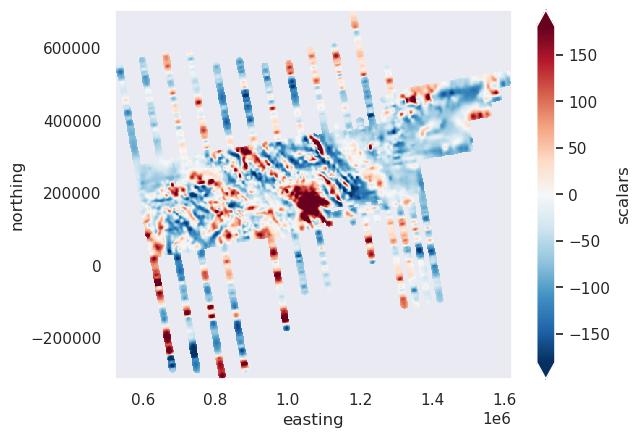
grid_unlevelled = grid_unlevelled.reset_coords(names="upward").scalars
grid_unlevelled.plot(robust=True)
[12]:
<matplotlib.collections.QuadMesh at 0x7ff33bd58ad0>
7.6. Level the survey#
[13]:
data_df, inters = airbornegeo.alternating_iterative_line_levelling(
data_df,
inters,
data_col="mag",
levelled_col="mag_levelled_trend0",
degree=0,
iterations=5,
)
inters.head()
Iteration: 100%|██████████| 5/5 [01:22<00:00, 16.49s/it]
[13]:
| line | tie | geometry | max_dist | easting | northing | dist_along_flight_line | dist_along_flight_tie | flight_interpolation_type | tie_interpolation_type | ... | mistie_1 | mistie_2 | mistie_3 | mistie_4 | mistie_5 | mistie_6 | mistie_7 | mistie_8 | mistie_9 | mistie_10 | |
|---|---|---|---|---|---|---|---|---|---|---|---|---|---|---|---|---|---|---|---|---|---|
| 0 | 1 | 143 | POINT (1158153 254083) | 16.441255 | 1158153.0 | 254083.0 | 545768.072695 | 138071.419338 | interpolated | interpolated | ... | 96.945621 | 72.958517 | 71.904752 | 67.038524 | 67.150418 | 63.393096 | 63.723800 | 60.721570 | 61.069625 | 58.628182 |
| 1 | 1 | 144 | POINT (1190820 259865) | 24.124887 | 1190820.0 | 259865.0 | 578952.394781 | 131585.125284 | interpolated | interpolated | ... | 28.638444 | 19.088634 | 18.034870 | 13.168642 | 13.280535 | 9.523214 | 9.853917 | 6.851688 | 7.199742 | 4.758299 |
| 2 | 1 | 145 | POINT (1223524 265689) | 17.269650 | 1223524.0 | 265689.0 | 612181.972720 | 147253.496664 | interpolated | interpolated | ... | 69.423514 | 49.368210 | 48.314446 | 43.448218 | 43.560111 | 39.802790 | 40.133493 | 37.131264 | 37.479318 | 35.037876 |
| 3 | 1 | 146 | POINT (1256193 271497) | 31.608179 | 1256193.0 | 271497.0 | 645372.035087 | 136211.666619 | interpolated | interpolated | ... | 80.612078 | 60.446633 | 59.392868 | 54.526640 | 54.638534 | 50.881212 | 51.211916 | 48.209686 | 48.557741 | 46.116298 |
| 4 | 1 | 147 | POINT (1288901 277249) | 50.174377 | 1288901.0 | 277249.0 | 678598.170740 | 155115.224990 | interpolated | interpolated | ... | -11.244436 | -2.791611 | -3.845375 | -8.711603 | -8.599710 | -12.357032 | -12.026328 | -15.028558 | -14.680503 | -17.121946 |
5 rows × 21 columns
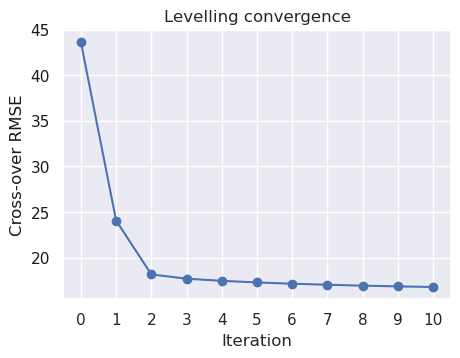
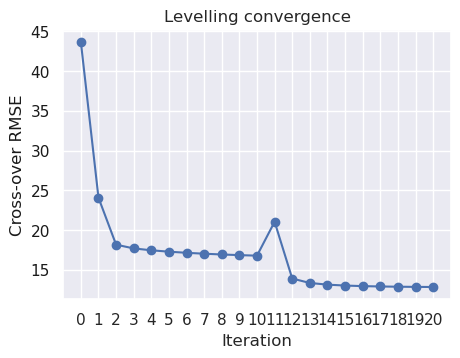
[14]:
airbornegeo.plot_levelling_convergence(inters)
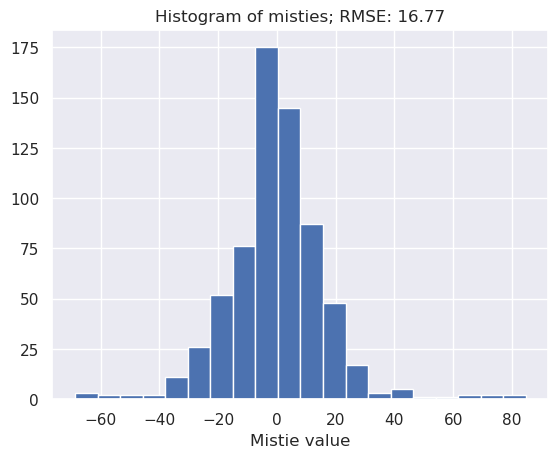
[15]:
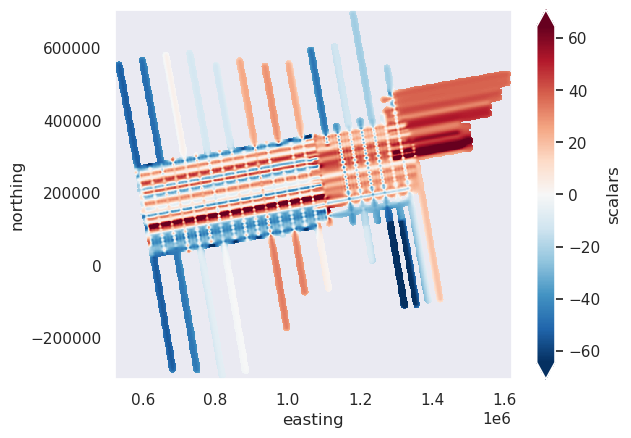
inters = airbornegeo.calculate_crossover_errors(
data_df,
inters,
data_col="mag_levelled_trend0",
plot_map=True,
)
[16]:
# block reduce the line data
data_df_blocked = airbornegeo.block_reduce(
data_df,
np.median,
spacing=2000,
reduce_by="distance_along_line",
groupby_column="line",
)
data_df_blocked = data_df_blocked.dropna(
subset=["easting", "northing", "height", "mag_levelled_trend0"]
)
data_df_blocked.describe()
Segments: 100%|██████████| 110/110 [00:14<00:00, 7.45it/s]
[16]:
| distance_along_line | easting | northing | height | unixtime | mag | intersecting_line | mag_levelled_trend0 | line | |
|---|---|---|---|---|---|---|---|---|---|
| count | 17035.000000 | 1.703500e+04 | 17035.000000 | 17035.000000 | 1.703500e+04 | 17035.000000 | 0.0 | 17035.000000 | 17035.000000 |
| mean | 190709.344148 | 1.016368e+06 | 237459.984304 | 3858.220164 | 1.230897e+09 | -12.277979 | NaN | -18.829659 | 97.929557 |
| std | 136541.851428 | 2.600426e+05 | 149691.744103 | 445.557159 | 6.576276e+05 | 88.700010 | NaN | 84.875107 | 62.661673 |
| min | 906.587566 | 5.328906e+05 | -302813.880978 | 2478.275000 | 1.229500e+09 | -362.340000 | NaN | -338.686624 | 1.000000 |
| 25% | 83114.751614 | 7.884050e+05 | 150079.397459 | 3615.325000 | 1.230456e+09 | -65.795000 | NaN | -70.579184 | 49.000000 |
| 50% | 168802.572822 | 1.004641e+06 | 236056.988635 | 4004.925000 | 1.230996e+09 | -22.175000 | NaN | -31.225921 | 85.000000 |
| 75% | 264878.758596 | 1.239572e+06 | 329857.396073 | 4194.350000 | 1.231484e+09 | 27.547500 | NaN | 17.801899 | 156.000000 |
| max | 742790.403584 | 1.609834e+06 | 695692.176078 | 4495.200000 | 1.232150e+09 | 847.370000 | NaN | 808.749276 | 206.000000 |
[17]:
coords = (
data_df_blocked.easting,
data_df_blocked.northing,
data_df_blocked.height,
)
eqs_levelled_trend_0 = hm.EquivalentSources(
damping=0.1, depth="default", block_size=2000
)
eqs_levelled_trend_0.fit(coords, data_df_blocked.mag_levelled_trend0)
[17]:
EquivalentSources(block_size=2000, damping=0.1)In a Jupyter environment, please rerun this cell to show the HTML representation or trust the notebook.
On GitHub, the HTML representation is unable to render, please try loading this page with nbviewer.org.
Parameters
| damping | 0.1 | |
| points | None | |
| depth | 'default' | |
| block_size | 2000 | |
| parallel | True | |
| dtype | 'float64' |
[18]:
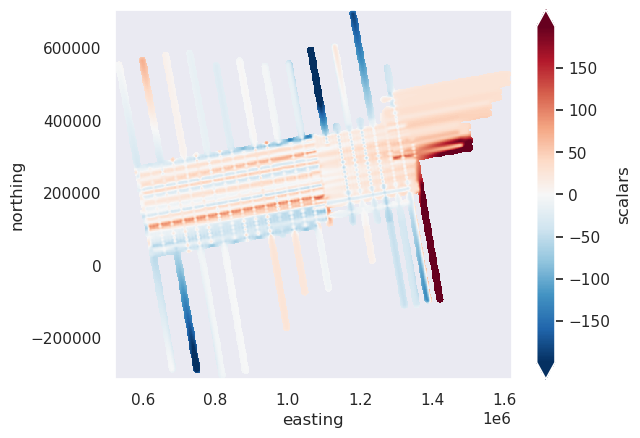
grid_levelled_trend_0 = eqs_levelled_trend_0.grid(grid_coords)
grid_levelled_trend_0 = vd.distance_mask(
(coords[0], coords[1]), maxdist=10e3, grid=grid_levelled_trend_0
)
grid_levelled_trend_0 = grid_levelled_trend_0.reset_coords(names="upward").scalars
grid_levelled_trend_0.plot(robust=True)
[18]:
<matplotlib.collections.QuadMesh at 0x7ff33bbeb390>
[19]:
(grid_unlevelled - grid_levelled_trend_0).plot(robust=True)
[19]:
<matplotlib.collections.QuadMesh at 0x7ff33bae11d0>
7.7. Repeat with a trend order of 1#
[20]:
data_df, inters = airbornegeo.alternating_iterative_line_levelling(
data_df,
inters,
data_col="mag",
levelled_col="mag_levelled_trend1",
degree=1,
iterations=5,
)
inters.head()
Iteration: 100%|██████████| 5/5 [01:25<00:00, 17.13s/it]
[20]:
| line | tie | geometry | max_dist | easting | northing | dist_along_flight_line | dist_along_flight_tie | flight_interpolation_type | tie_interpolation_type | ... | mistie_11 | mistie_12 | mistie_13 | mistie_14 | mistie_15 | mistie_16 | mistie_17 | mistie_18 | mistie_19 | mistie_20 | |
|---|---|---|---|---|---|---|---|---|---|---|---|---|---|---|---|---|---|---|---|---|---|
| 0 | 1 | 143 | POINT (1158153 254083) | 16.441255 | 1158153.0 | 254083.0 | 545768.072695 | 138071.419338 | interpolated | interpolated | ... | 85.390637 | 53.830704 | 50.428968 | 47.406472 | 45.290888 | 43.475684 | 42.384815 | 41.138719 | 40.572418 | 39.700654 |
| 1 | 1 | 144 | POINT (1190820 259865) | 24.124887 | 1190820.0 | 259865.0 | 578952.394781 | 131585.125284 | interpolated | interpolated | ... | 14.857246 | 4.930539 | 1.394638 | -1.040580 | -3.329380 | -4.819601 | -6.004392 | -7.036234 | -7.651205 | -8.375117 |
| 2 | 1 | 145 | POINT (1223524 265689) | 17.269650 | 1223524.0 | 265689.0 | 612181.972720 | 147253.496664 | interpolated | interpolated | ... | 53.413067 | 37.042316 | 33.372066 | 31.524115 | 29.061863 | 27.896855 | 26.618016 | 25.800627 | 25.136921 | 24.561012 |
| 3 | 1 | 146 | POINT (1256193 271497) | 31.608179 | 1256193.0 | 271497.0 | 645372.035087 | 136211.666619 | interpolated | interpolated | ... | 62.375033 | 48.273736 | 44.469298 | 43.210468 | 40.574970 | 39.736369 | 38.363591 | 37.761503 | 37.049120 | 36.621833 |
| 4 | 1 | 147 | POINT (1288901 277249) | 50.174377 | 1288901.0 | 277249.0 | 678598.170740 | 155115.224990 | interpolated | interpolated | ... | -31.710499 | -10.507246 | -14.446019 | -15.118106 | -17.927039 | -18.440708 | -19.907525 | -20.295314 | -21.056429 | -21.335793 |
5 rows × 31 columns
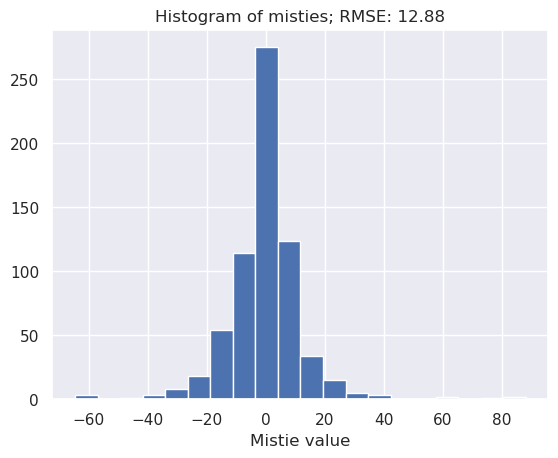
[21]:
airbornegeo.plot_levelling_convergence(inters)
[22]:
inters = airbornegeo.calculate_crossover_errors(
data_df,
inters,
data_col="mag_levelled_trend1",
plot_map=True,
)
[23]:
# block reduce the line data
data_df_blocked = airbornegeo.block_reduce(
data_df,
np.median,
spacing=2000,
reduce_by="distance_along_line",
groupby_column="line",
)
data_df_blocked = data_df_blocked.dropna(
subset=["easting", "northing", "height", "mag_levelled_trend1"]
)
data_df_blocked.describe()
Segments: 100%|██████████| 110/110 [00:18<00:00, 6.01it/s]
[23]:
| distance_along_line | easting | northing | height | unixtime | mag | intersecting_line | mag_levelled_trend0 | mag_levelled_trend1 | line | |
|---|---|---|---|---|---|---|---|---|---|---|
| count | 17035.000000 | 1.703500e+04 | 17035.000000 | 17035.000000 | 1.703500e+04 | 17035.000000 | 0.0 | 17035.000000 | 17035.000000 | 17035.000000 |
| mean | 190709.344148 | 1.016368e+06 | 237459.984304 | 3858.220164 | 1.230897e+09 | -12.277979 | NaN | -18.829659 | -25.135924 | 97.929557 |
| std | 136541.851428 | 2.600426e+05 | 149691.744103 | 445.557159 | 6.576276e+05 | 88.700010 | NaN | 84.875107 | 120.427276 | 62.661673 |
| min | 906.587566 | 5.328906e+05 | -302813.880978 | 2478.275000 | 1.229500e+09 | -362.340000 | NaN | -338.686624 | -1221.914209 | 1.000000 |
| 25% | 83114.751614 | 7.884050e+05 | 150079.397459 | 3615.325000 | 1.230456e+09 | -65.795000 | NaN | -70.579184 | -78.242411 | 49.000000 |
| 50% | 168802.572822 | 1.004641e+06 | 236056.988635 | 4004.925000 | 1.230996e+09 | -22.175000 | NaN | -31.225921 | -32.840830 | 85.000000 |
| 75% | 264878.758596 | 1.239572e+06 | 329857.396073 | 4194.350000 | 1.231484e+09 | 27.547500 | NaN | 17.801899 | 23.628895 | 156.000000 |
| max | 742790.403584 | 1.609834e+06 | 695692.176078 | 4495.200000 | 1.232150e+09 | 847.370000 | NaN | 808.749276 | 790.794124 | 206.000000 |
[24]:
coords = (
data_df_blocked.easting,
data_df_blocked.northing,
data_df_blocked.height,
)
eqs_levelled_trend_1 = hm.EquivalentSources(
damping=0.1, depth="default", block_size=2000
)
eqs_levelled_trend_1.fit(coords, data_df_blocked.mag_levelled_trend1)
[24]:
EquivalentSources(block_size=2000, damping=0.1)In a Jupyter environment, please rerun this cell to show the HTML representation or trust the notebook.
On GitHub, the HTML representation is unable to render, please try loading this page with nbviewer.org.
Parameters
| damping | 0.1 | |
| points | None | |
| depth | 'default' | |
| block_size | 2000 | |
| parallel | True | |
| dtype | 'float64' |
[25]:
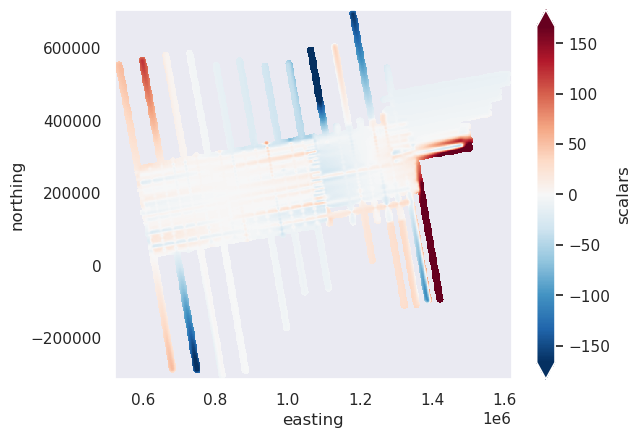
grid_levelled_trend_1 = eqs_levelled_trend_1.grid(grid_coords)
grid_levelled_trend_1 = vd.distance_mask(
(coords[0], coords[1]), maxdist=10e3, grid=grid_levelled_trend_1
)
grid_levelled_trend_1 = grid_levelled_trend_1.reset_coords(names="upward").scalars
grid_levelled_trend_1.plot(robust=True)
[25]:
<matplotlib.collections.QuadMesh at 0x7ff33b840e10>
[26]:
(grid_unlevelled - grid_levelled_trend_1).plot(robust=True)
[26]:
<matplotlib.collections.QuadMesh at 0x7ff34a89e850>
[27]:
(grid_levelled_trend_0 - grid_levelled_trend_1).plot(robust=True)
[27]:
<matplotlib.collections.QuadMesh at 0x7ff34a7f8cd0>
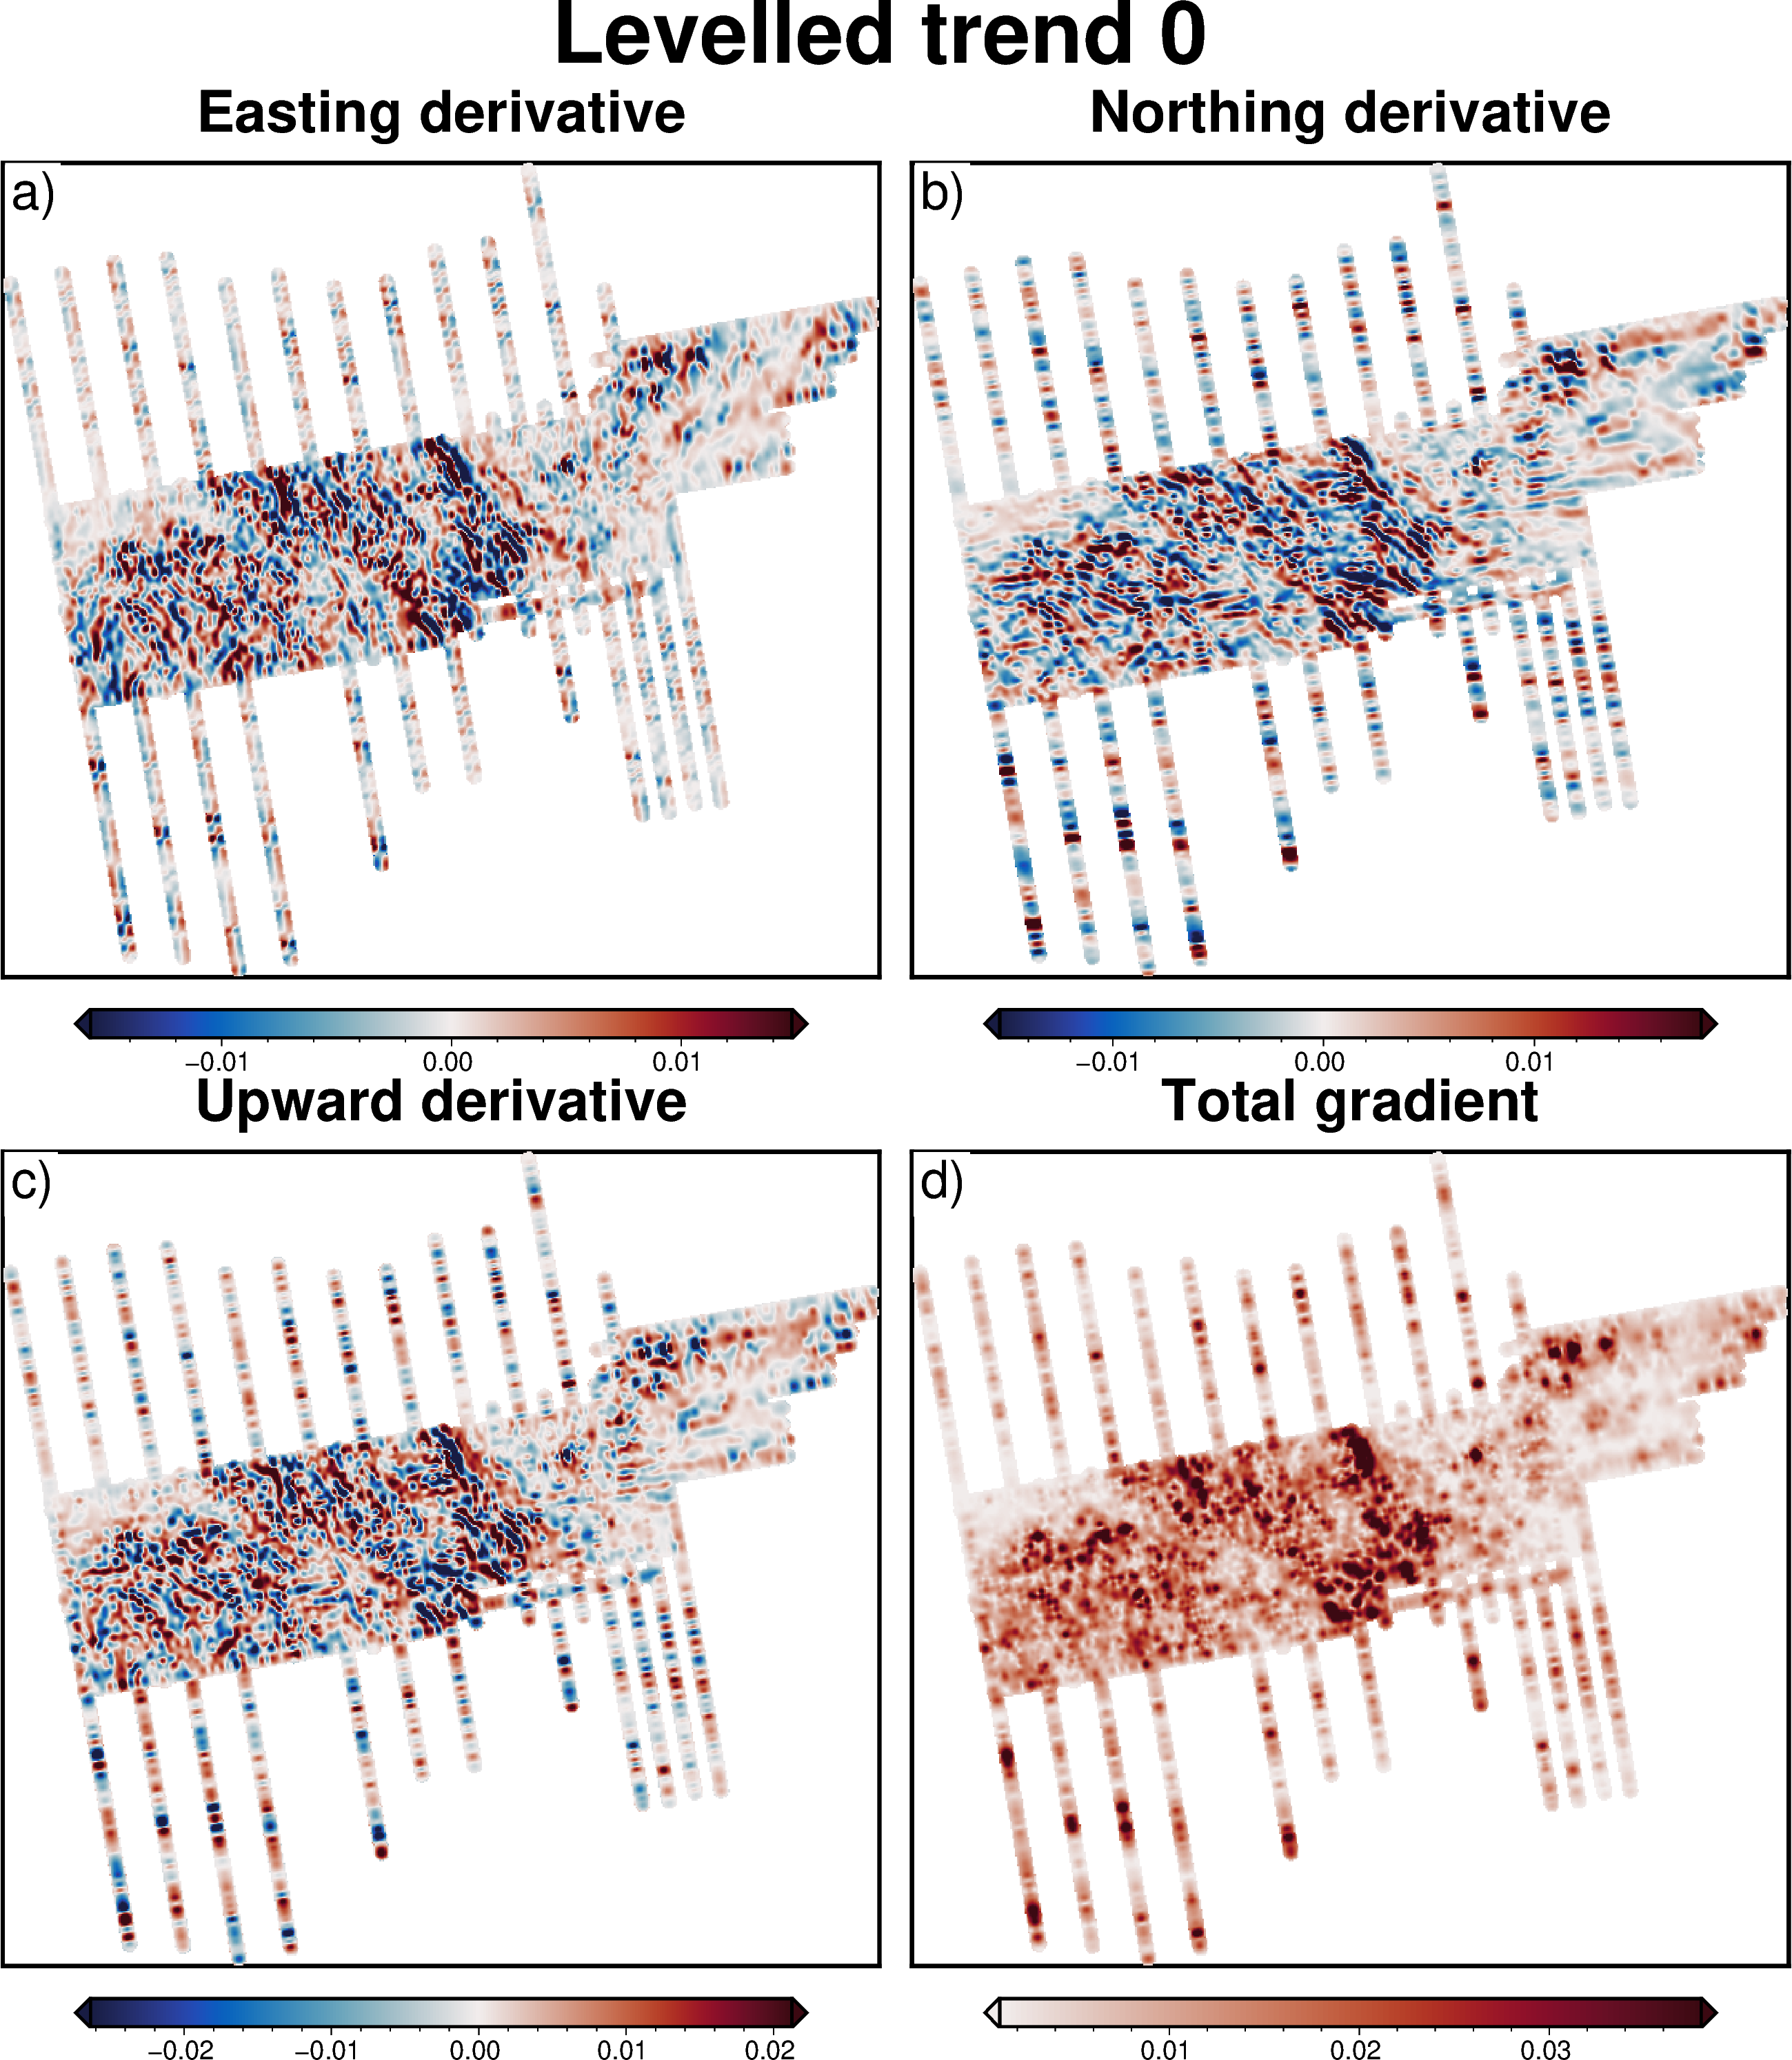
7.8. Use spatial derivatives to assess levelling performance#
[29]:
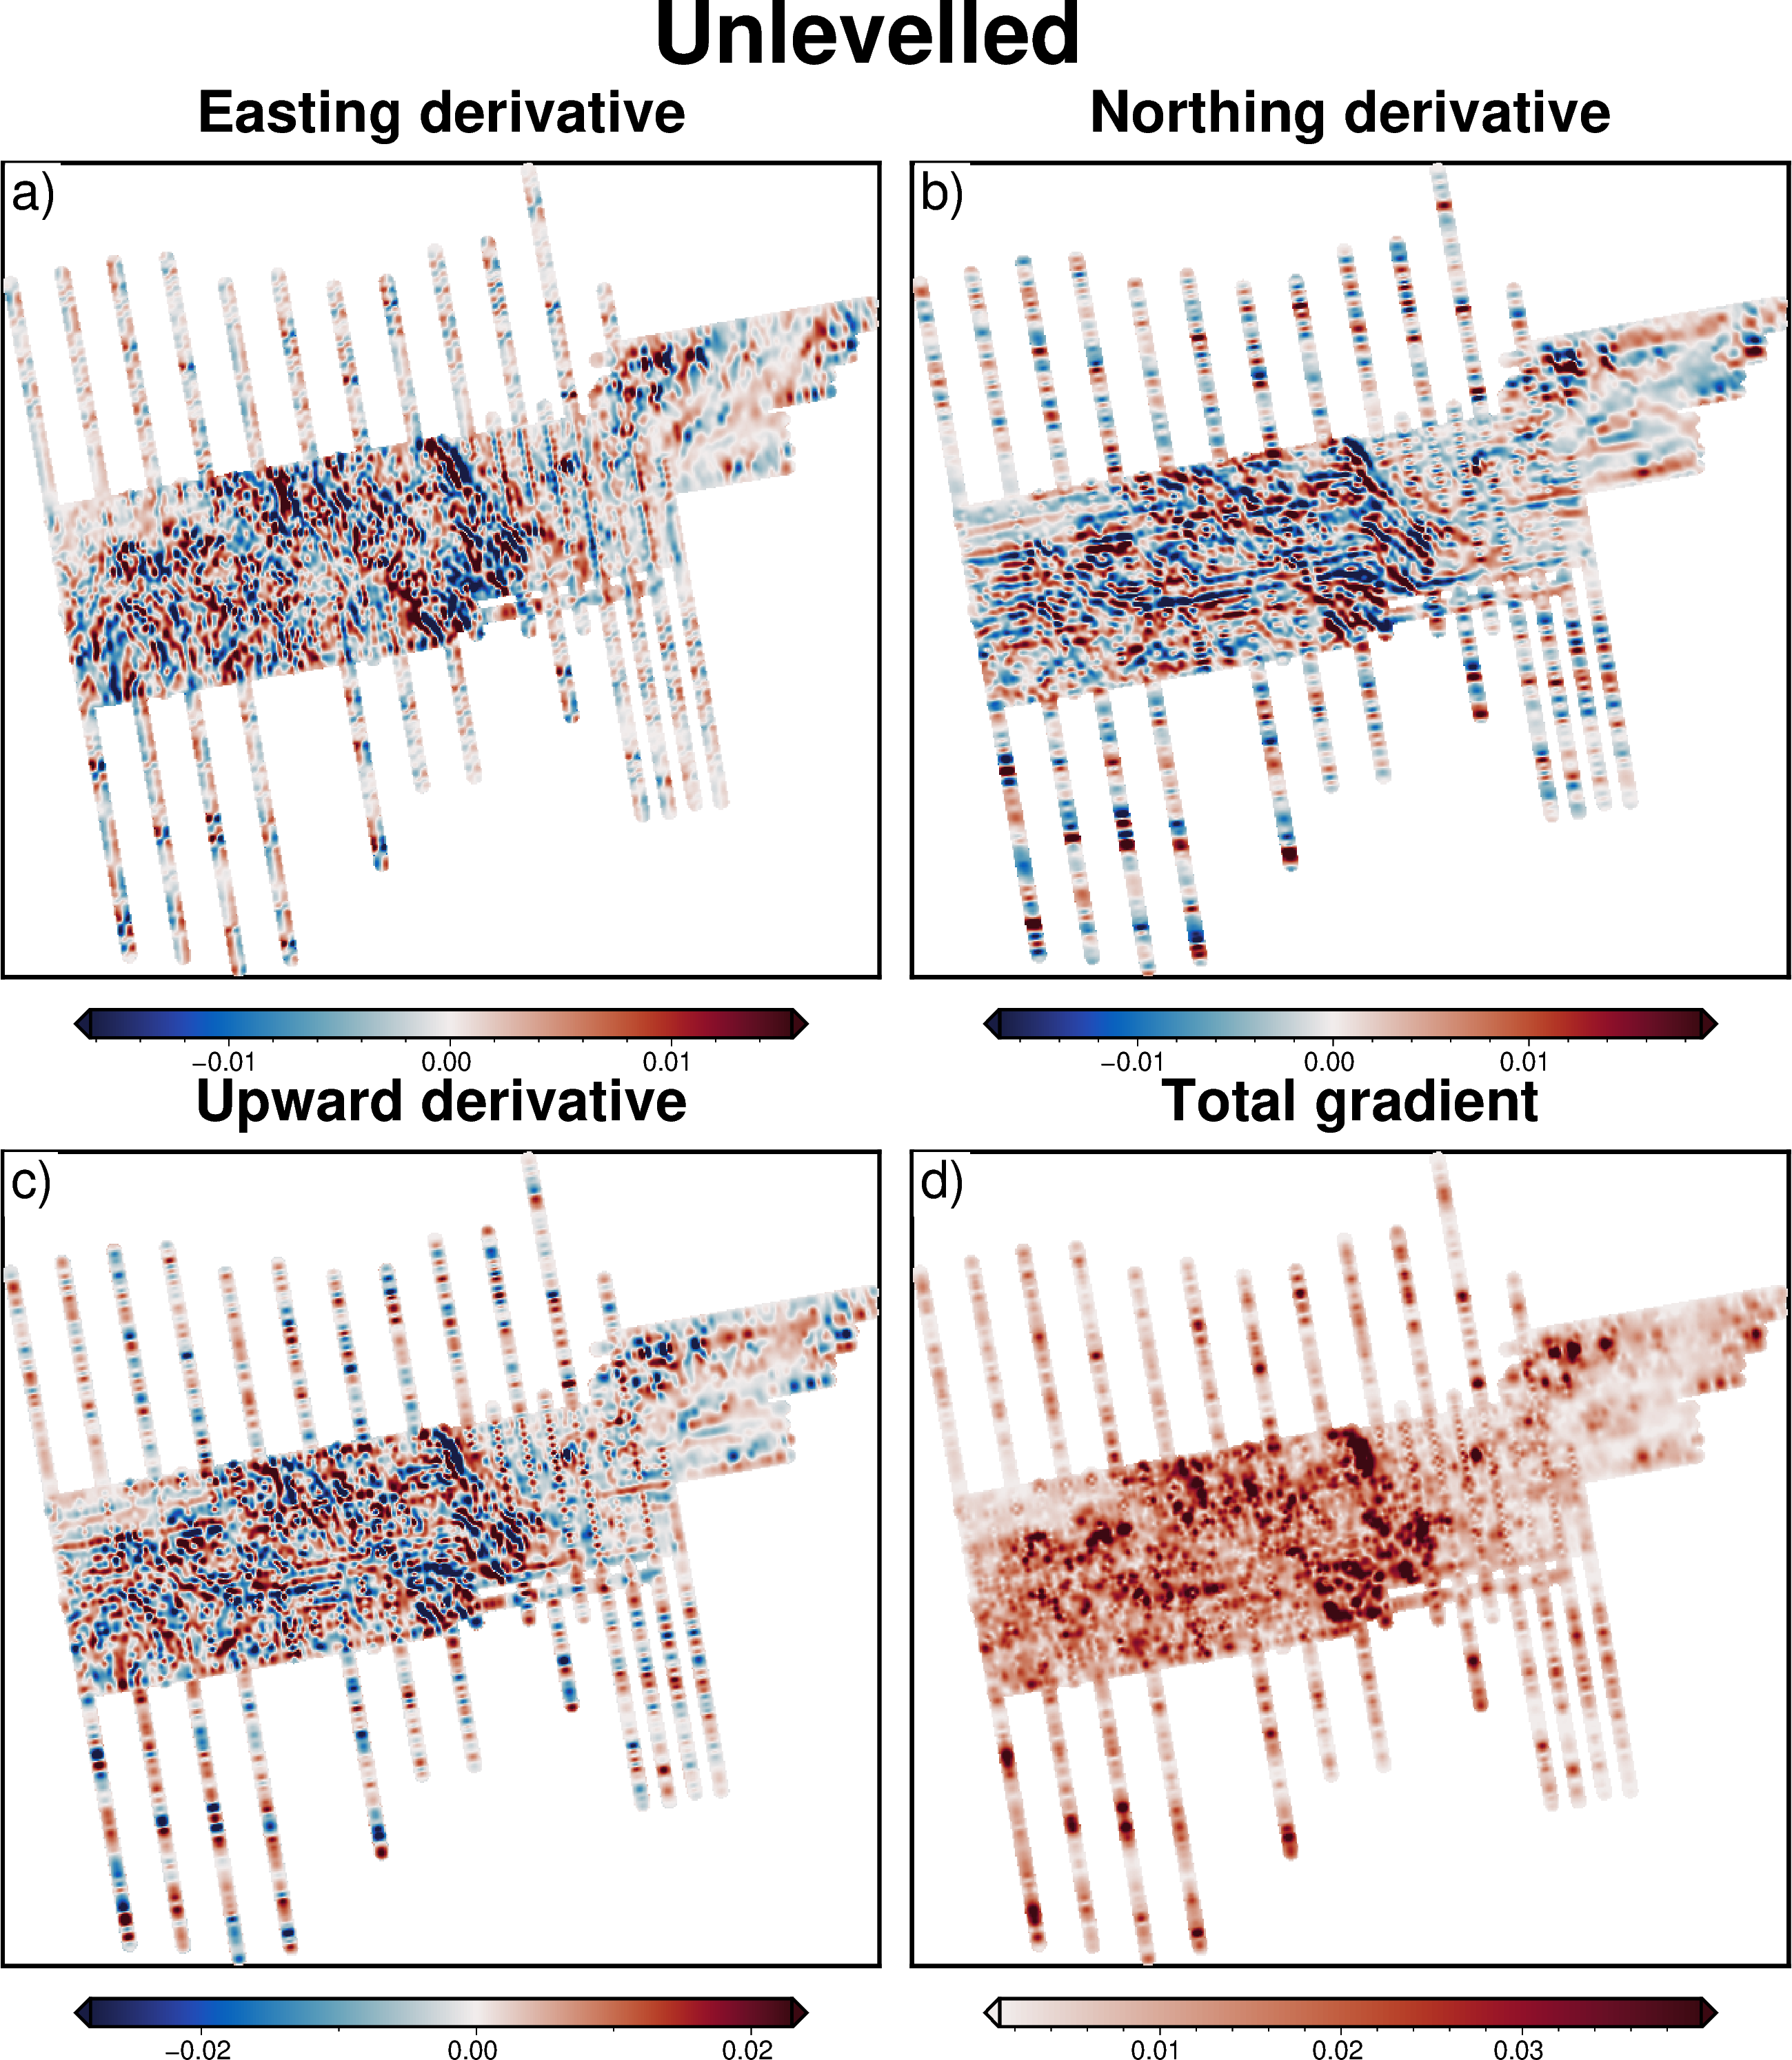
titles = [
"Unlevelled ",
"Levelled trend 0",
"Levelled trend 1",
]
for i, g in enumerate(
[
grid_unlevelled,
grid_levelled_trend_0,
grid_levelled_trend_1,
]
):
east_deriv = airbornegeo.filter_grid(
g,
filter_type="easting_deriv",
)
north_deriv = airbornegeo.filter_grid(g, filter_type="northing_deriv")
up_deriv = airbornegeo.filter_grid(
g,
filter_type="up_deriv",
)
total_gradient = airbornegeo.filter_grid(
g,
filter_type="total_gradient",
)
fig = ptk.subplots(
[east_deriv, north_deriv, up_deriv, total_gradient],
fig_title=titles[i],
titles=[
"Easting derivative",
"Northing derivative",
"Upward derivative",
"Total gradient",
],
cmap="balance+h0",
robust=True,
fig_height=10,
epsg="3031",
)
fig.show()
/home/sungw937/airbornegeo/.pixi/envs/default/lib/python3.14/site-packages/harmonica/filters/_fft.py:48: FutureWarning: dropping variables using `drop` is deprecated; use drop_vars.
grid = grid.drop(bad_coords)
/home/sungw937/airbornegeo/.pixi/envs/default/lib/python3.14/site-packages/xrft/xrft.py:560: FutureWarning: Default ifft's behaviour (lag=None) changed! Default value of lag was zero (centered output coordinates) and is now set to transformed coordinate's attribute: 'direct_lag'.
warnings.warn(msg, FutureWarning)
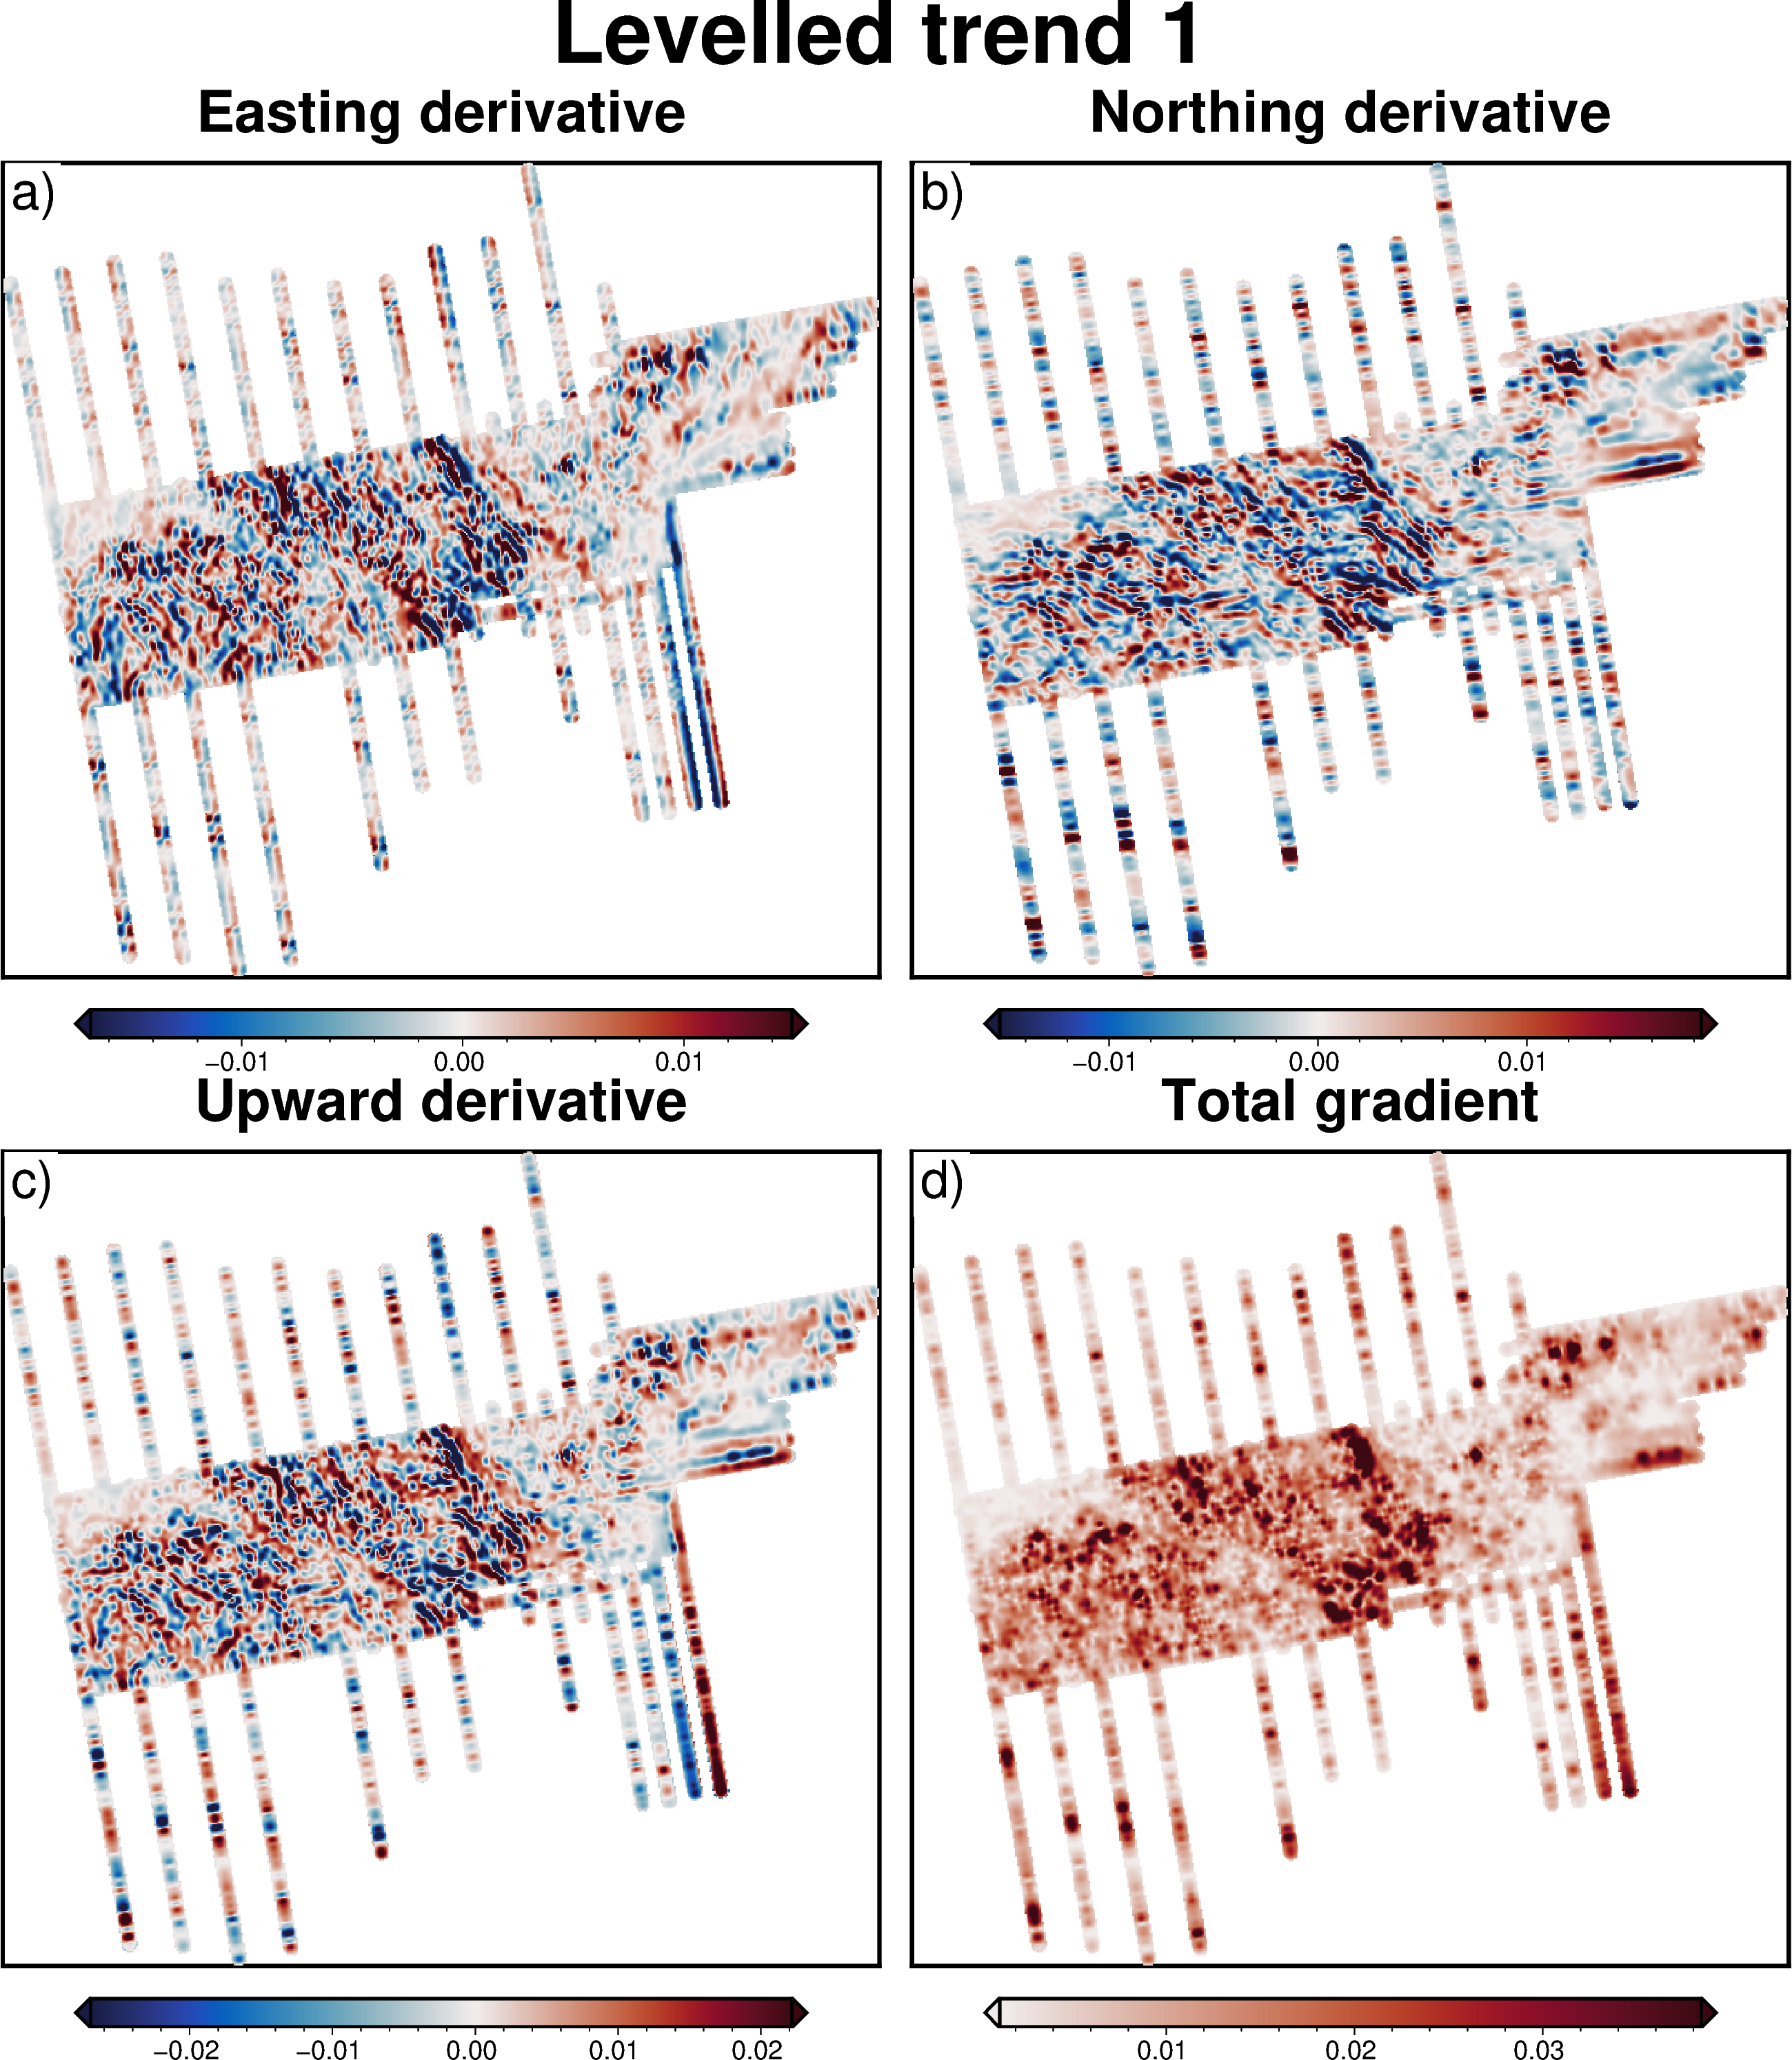
The above plots show the easting, northing, and upward derivatives, and the total gradients, for the unlevelled grid, and the grid levelled with trend orders 0 and 1. These highlight the levelling errors in the data. These errors appear to be significantly reduced with the levelling.