Filtering data in 1D#
[1]:
# %load_ext autoreload
# %autoreload 2

import cmocean
import numpy as np
import pandas as pd
import verde as vd

import airbornegeo
[2]:
data_df = pd.read_csv("data/AGAP_gravity_survey_processed.csv")
data_df = data_df[
    [
        "easting",
        "northing",
        "line",
        "unixtime",
        "grav_disturbance",
        "distance_along_line",
        "height",
    ]
]
data_df = data_df.sort_values(["line", "unixtime"]).reset_index(drop=True)
data_df.head()
[2]:
| easting | northing | line | unixtime | grav_disturbance | distance_along_line | height | |
|---|---|---|---|---|---|---|---|
| 0 | 1.000024e+06 | 226237.330771 | 1 | 1.229507e+09 | 1186.4 | 0.000000 | 4156.1 |
| 1 | 1.000083e+06 | 226246.631269 | 1 | 1.229507e+09 | 342.1 | 59.842447 | 4156.0 |
| 2 | 1.000142e+06 | 226255.809132 | 1 | 1.229507e+09 | -1965.9 | 119.693401 | 4156.1 |
| 3 | 1.000201e+06 | 226264.969079 | 1 | 1.229507e+09 | 820.0 | 179.545645 | 4156.4 |
| 4 | 1.000260e+06 | 226274.156809 | 1 | 1.229507e+09 | 3198.0 | 239.285174 | 4156.6 |
[3]:
# extract a single line from the survey
line_df = data_df[data_df.line == 4]

# Create a survey for the single-line demo
line_survey = airbornegeo.Survey(
    line_df,
    line_column="line",
    distance_column="distance_along_line",
)
Filter a line#
Spatial filtering#
We can perform 1D filtering based on the distance along the flight line.
[4]:
line_survey.filter_line(
    filter_width=19_000,  # 19 km low pass gaussian filter
    filter_type="lowpass",
    filter_shape="gaussian",
    data_column="grav_disturbance",
    filter_by_column="distance_along_line",
    result_column="grav_disturbance_filtered_spatial",
    pad_width_percentage=10,
)
[4]:
airbornegeo.Survey 3,762 rows × 8 columns
Column attributes
| line | line |
| line_type | not set |
| distance | distance_along_line |
| time | not set |
| height | not set |
| latitude | not set |
| longitude | not set |
CRS & metadata0 metadata entries
| crs | None |
Statistics0/8 computed — access an attribute or call .describe()
| region | not computed |
| line_counts | not computed |
| line_lengths | not computed |
| total_length | not computed |
| median_line_lengths | not computed |
| line_azimuths | not computed |
| mean_line_azimuths | not computed |
| median_line_spacings | not computed |
IntersectionsNone
None — call create_intersection_table()
Datafirst 5 rows
| easting | northing | line | unixtime | grav_disturbance | distance_along_line | height | grav_disturbance_filtered_spatial | |
|---|---|---|---|---|---|---|---|---|
| 8591 | 1.316050e+06 | 392090.546753 | 4 | 1.230570e+09 | 1971.6 | 0.000000 | 3574.5 | -17.269885 |
| 8592 | 1.315990e+06 | 392078.637888 | 4 | 1.230570e+09 | 1878.6 | 61.614338 | 3574.3 | -17.272291 |
| 8593 | 1.315929e+06 | 392066.728534 | 4 | 1.230570e+09 | -602.0 | 123.228587 | 3574.0 | -17.279394 |
| 8594 | 1.315869e+06 | 392054.833235 | 4 | 1.230570e+09 | -2875.9 | 184.956734 | 3573.7 | -17.291215 |
| 8595 | 1.315808e+06 | 392042.937442 | 4 | 1.230570e+09 | 39.0 | 246.684793 | 3573.5 | -17.307745 |
[5]:
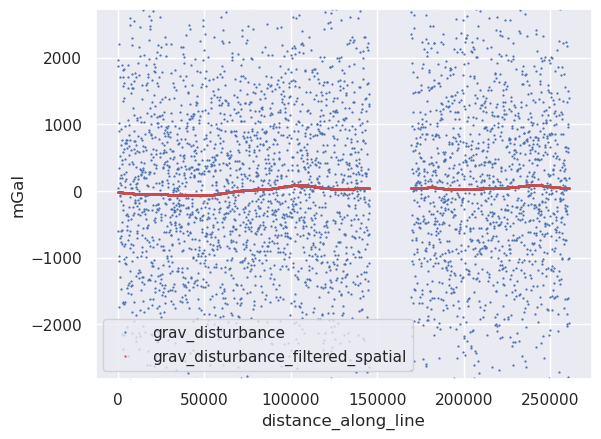
maxabs = vd.maxabs(line_df.grav_disturbance, percentile=60)
ax = line_df.plot.line(
    "distance_along_line",
    "grav_disturbance",
    style="b.",
    ms=0.6,
    ylim=(-maxabs, maxabs),
)
ax = line_df.plot.line(
    "distance_along_line",
    "grav_disturbance_filtered_spatial",
    style="r.",
    ms=0.6,
    ax=ax,
    ylim=(-maxabs, maxabs),
)
ax.set_ylabel("mGal")
---------------------------------------------------------------------------
KeyError                                  Traceback (most recent call last)
File ~/airbornegeo/.pixi/envs/default/lib/python3.14/site-packages/pandas/core/indexes/base.py:3641, in Index.get_loc(self, key)
   3640 try:
-> 3641     return self._engine.get_loc(casted_key)
   3642 except KeyError as err:

File pandas/_libs/index.pyx:168, in pandas._libs.index.IndexEngine.get_loc()
--> 168 'Could not get source, probably due dynamically evaluated source code.'

File pandas/_libs/index.pyx:197, in pandas._libs.index.IndexEngine.get_loc()
--> 197 'Could not get source, probably due dynamically evaluated source code.'

File pandas/_libs/hashtable_class_helper.pxi:7668, in pandas._libs.hashtable.PyObjectHashTable.get_item()
-> 7668 'Could not get source, probably due dynamically evaluated source code.'

File pandas/_libs/hashtable_class_helper.pxi:7676, in pandas._libs.hashtable.PyObjectHashTable.get_item()
-> 7676 'Could not get source, probably due dynamically evaluated source code.'

KeyError: 'grav_disturbance_filtered_spatial'

The above exception was the direct cause of the following exception:

KeyError                                  Traceback (most recent call last)
Cell In[5], line 9
      5     style="b.",
      6     ms=0.6,
      7     ylim=(-maxabs, maxabs),
      8 )
----> 9 ax = line_df.plot.line(
     10     "distance_along_line",
     11     "grav_disturbance_filtered_spatial",
     12     style="r.",

File ~/airbornegeo/.pixi/envs/default/lib/python3.14/site-packages/pandas/plotting/_core.py:1295, in PlotAccessor.line(self, x, y, color, **kwargs)
   1293 if color is not None:
   1294     kwargs["color"] = color
-> 1295 return self(kind="line", x=x, y=y, **kwargs)

File ~/airbornegeo/.pixi/envs/default/lib/python3.14/site-packages/pandas/plotting/_core.py:1169, in PlotAccessor.__call__(self, *args, **kwargs)
   1166         except (IndexError, KeyError, TypeError):
   1167             pass
-> 1169 data = data[y]
   1171 if isinstance(data, ABCSeries):
   1172     label_name = label_kw or y

File ~/airbornegeo/.pixi/envs/default/lib/python3.14/site-packages/pandas/core/frame.py:4378, in DataFrame.__getitem__(self, key)
   4374
   4375         if is_single_key:
   4376             if self.columns.nlevels > 1:
   4377                 return self._getitem_multilevel(key)
-> 4378             indexer = self.columns.get_loc(key)
   4379             if is_integer(indexer):
   4380                 indexer = [indexer]
   4381         else:

File ~/airbornegeo/.pixi/envs/default/lib/python3.14/site-packages/pandas/core/indexes/base.py:3648, in Index.get_loc(self, key)
   3643     if isinstance(casted_key, slice) or (
   3644         isinstance(casted_key, abc.Iterable)
   3645         and any(isinstance(x, slice) for x in casted_key)
   3646     ):
   3647         raise InvalidIndexError(key) from err
-> 3648     raise KeyError(key) from err
   3649 except TypeError:
   3650     # If we have a listlike key, _check_indexing_error will raise
   3651     #  InvalidIndexError. Otherwise we fall through and re-raise
   3652     #  the TypeError.
   3653     self._check_indexing_error(key)

KeyError: 'grav_disturbance_filtered_spatial'
Temporal filtering#
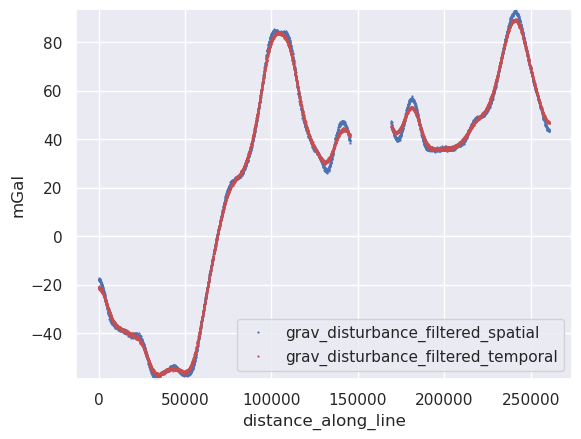
We can also perform 1D filtering based on the time.
[ ]:
line_df = line_df.sort_values("unixtime")

line_survey = airbornegeo.Survey(
    line_df,
    line_column="line",
    distance_column="distance_along_line",
)

line_survey.filter_line(
    filter_width=400,  # 400 sec low pass gaussian filter
    filter_type="lowpass",
    filter_shape="gaussian",
    data_column="grav_disturbance",
    filter_by_column="unixtime",
    result_column="grav_disturbance_filtered_temporal",
    pad_width_percentage=10,
)
[ ]:
ax = line_df.plot.line(
    "distance_along_line",
    "grav_disturbance",
    style="b.",
    ms=0.6,
    ylim=(-maxabs, maxabs),
)
ax = line_df.plot.line(
    "distance_along_line",
    "grav_disturbance_filtered_temporal",
    style="r.",
    ms=0.6,
    ax=ax,
    ylim=(-maxabs, maxabs),
)
ax.set_ylabel("mGal")
Text(0, 0.5, 'mGal')
Filtering with equivalent sources#
If our data is gravity or magnetic anomalies, an alternative method is to fit an equivalent source model to the unfiltered data, and either either block-reduction, damping, source-depth, or predicting at a high elevation (upward continuation) to smooth the data.
[ ]:
eqs = line_survey.eq_sources_1d(
    data_column="grav_disturbance",
    depth="default",
    damping=1e4,
    block_size=500,
)

line_df["grav_disturbance_filtered_eqs"] = eqs.predict(
    (
        line_df.distance_along_line,
        np.zeros_like(line_df.distance_along_line),
        line_df.height,
        # np.full_like(line_df.height, 10e3) # use this if you want to upward continue the data
    )
)
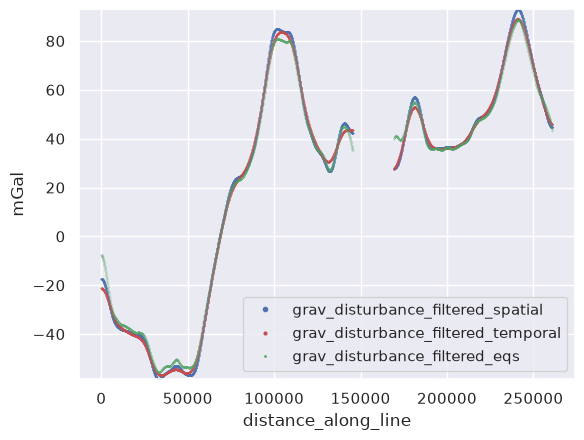
Compare filtering methods#
[ ]:
ylim = vd.minmax(
    line_df[
        [
            "grav_disturbance_filtered_spatial",
            "grav_disturbance_filtered_temporal",
            "grav_disturbance_filtered_eqs",
        ]
    ],
)
ax = line_df.plot.line(
    "distance_along_line",
    "grav_disturbance_filtered_spatial",
    style="b.",
    ms=0.6,
    ylim=ylim,
)
ax = line_df.plot.line(
    "distance_along_line",
    "grav_disturbance_filtered_temporal",
    style="r.",
    ms=0.4,
    ax=ax,
    ylim=ylim,
)
ax = line_df.plot.line(
    "distance_along_line",
    "grav_disturbance_filtered_eqs",
    style="g.",
    ms=0.2,
    ax=ax,
    ylim=ylim,
)
ax.legend(markerscale=10)
ax.set_ylabel("mGal")
Text(0, 0.5, 'mGal')
Filter all lines in a survey#
Spatial filtering#
[ ]:
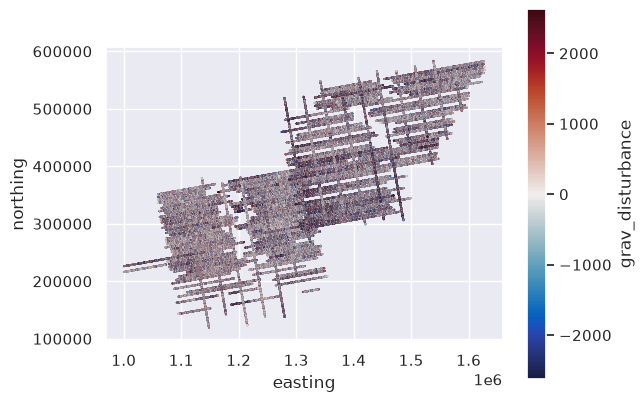
# plot the unfiltered gravity disturbance data
maxabs = vd.maxabs(line_df.grav_disturbance, percentile=95)
ax = data_df.plot.scatter(
    "easting",
    "northing",
    c="grav_disturbance",
    s=0.1,
    cmap=cmocean.cm.balance,
    vmin=-maxabs,
    vmax=maxabs,
)
ax.set_aspect("equal")
[ ]:
# Create survey for full dataset
survey = airbornegeo.Survey(
    data_df,
    line_column="line",
    distance_column="distance_along_line",
)
[ ]:
survey.filter_line(
    filter_width=19_000,  # 19 km low pass gaussian filter
    filter_type="lowpass",
    filter_shape="gaussian",
    data_column="grav_disturbance",
    filter_by_column="distance_along_line",
    result_column="grav_disturbance_filtered_spatial",
    pad_width_percentage=10,
)
[ ]:
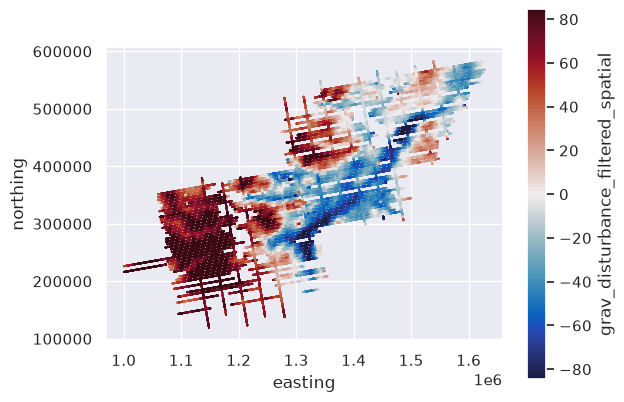
# plot the filtered gravity disturbance data
maxabs = vd.maxabs(line_df.grav_disturbance_filtered_spatial, percentile=95)
ax = data_df.plot.scatter(
    "easting",
    "northing",
    c="grav_disturbance_filtered_spatial",
    s=0.1,
    cmap=cmocean.cm.balance,
    vmin=-maxabs,
    vmax=maxabs,
)
ax.set_aspect("equal")
Temporal filtering#
[ ]:
survey.filter_line(
    filter_width=500,  # 500 sec low pass gaussian filter
    filter_type="lowpass",
    filter_shape="gaussian",
    data_column="grav_disturbance",
    filter_by_column="unixtime",
    result_column="grav_disturbance_filtered_temporal",
    pad_width_percentage=10,
)
[ ]:
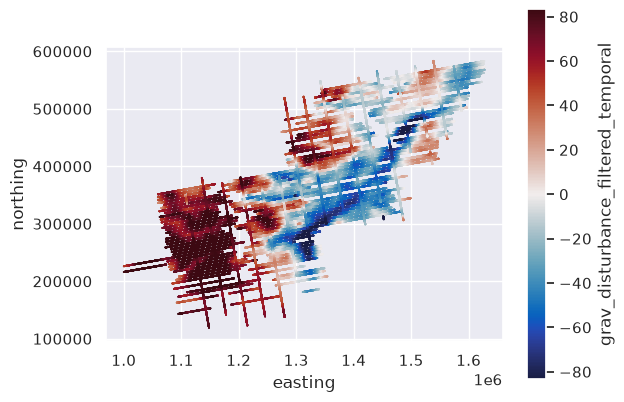
# plot the filtered gravity disturbance data
maxabs = vd.maxabs(line_df.grav_disturbance_filtered_temporal, percentile=95)
ax = data_df.plot.scatter(
    "easting",
    "northing",
    c="grav_disturbance_filtered_temporal",
    s=0.1,
    cmap=cmocean.cm.balance,
    vmin=-maxabs,
    vmax=maxabs,
)
ax.set_aspect("equal")
Equivalent source filtering#
[ ]:
eqs = survey.eq_sources_1d(
    data_column="grav_disturbance",
    depth="default",
    damping=1e4,
    # damping=1e5,
    # damping=1e6,
    block_size=500,
)
[ ]:
pbar = data_df.groupby("line")
for segment_name, segment_data in pbar:
    line_eqs = eqs[segment_name]
    data_df.loc[data_df.line == segment_name, "grav_disturbance_filtered_eqs"] = (
        line_eqs.predict(
            (
                segment_data.distance_along_line,
                np.zeros_like(segment_data.distance_along_line),
                segment_data.height,
            )
        )
    )
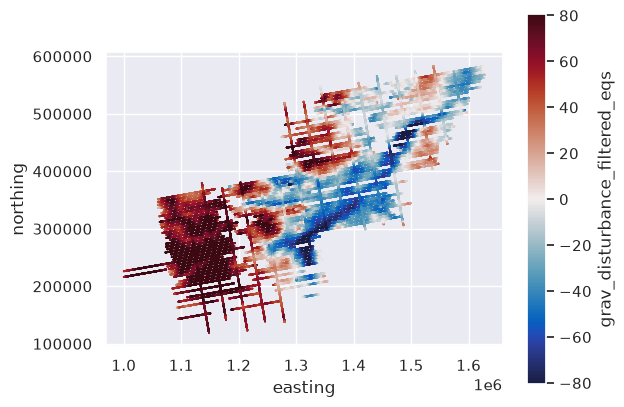
[ ]:
# plot the filtered gravity disturbance data
maxabs = vd.maxabs(line_df.grav_disturbance_filtered_eqs, percentile=95)
ax = data_df.plot.scatter(
    "easting",
    "northing",
    c="grav_disturbance_filtered_eqs",
    s=0.1,
    cmap=cmocean.cm.balance,
    vmin=-maxabs,
    vmax=maxabs,
)
ax.set_aspect("equal")