
Using equivalent sources for cross-over errors#
For some data types, such as gravity and magnetics, the value of the data depends on the the elevation it was collected at. For an intersection, if the two lines were flown at different altitudes, the intersection point is only the intersection in 2D space, not in 3D. To make it a true 3D intersection, we can perform upward continuation on the data so that the values of both lines represent the values that would have been observed if the flights were flown at the same altitude. We don’t actually need to upward continue the entire lines, just the single points which make up the intersection.
[1]:
%load_ext autoreload
%autoreload 2


import logging

import cmocean
import matplotlib.pyplot as plt
import numpy as np
import pandas as pd
import plotly.io as pio
import verde as vd

import airbornegeo

# setup logging to get some additional info from the airbornegeo functions
logging.getLogger("airbornegeo").setLevel("INFO")
logging.basicConfig()
pio.renderers.default = "notebook"
Load data#
This is a subset of the BAS AGAP gravity survey over Antarctica’s Gamburtsev Subglacial Mountains. The file is downloaded and subset in the notebook AGAP_gravity_survey.
[2]:
data_df = pd.read_csv("data/AGAP_gravity_survey_processed_blocked.csv")
data_df = data_df[
    [
        "easting",
        "northing",
        "height",
        "line",
        "unixtime",
        "distance_along_line",
        "grav_disturbance_filt",
    ]
]

# every x points
data_df = data_df[::10]

# every x line
data_df = data_df[
    data_df.line.isin(data_df.line.unique()[data_df.line.unique() % 2 == 0])
]

# drop rows with any nans
data_df = data_df.dropna(how="any")

# define flight lines vs tie lines
data_df["line_type"] = np.where(data_df.line >= 85, 1, 0)

data_df.head()
[2]:
| easting | northing | height | line | unixtime | distance_along_line | grav_disturbance_filt | line_type | |
|---|---|---|---|---|---|---|---|---|
| 1110 | 1.253930e+06 | 271061.720685 | 3559.30 | 2 | 1.229511e+09 | 1717.794135 | -26.490 | 0 |
| 1120 | 1.255875e+06 | 271454.343986 | 3564.95 | 2 | 1.229511e+09 | 3703.893309 | -24.335 | 0 |
| 1130 | 1.257852e+06 | 271705.095256 | 3562.50 | 2 | 1.229511e+09 | 5697.944793 | -23.490 | 0 |
| 1140 | 1.259832e+06 | 272100.496815 | 3560.90 | 2 | 1.229511e+09 | 7716.419708 | -26.920 | 0 |
| 1150 | 1.261763e+06 | 272461.003356 | 3558.30 | 2 | 1.229511e+09 | 9681.284807 | -32.900 | 0 |
[ ]:
survey = airbornegeo.Survey(
    data_df,
    line_column="line",
    line_type_column="line_type",
    distance_column="distance_along_line",
)
survey
[ ]:
ax = survey.plot(color_by="line", cmap="rainbow", s=2)
Find intersections and interpolate their values#
See previous notebooks for more details on these steps.
[ ]:
# calculate theoretical intersection points
survey.create_intersection_table(method="groups")

# interpolate data values at intersections
survey.interpolate_intersections(
    to_interp="grav_disturbance_filt",
    window_width=1000,
    method="cubic",
    extrapolate=True,
)
Calculate intersection crossover errors#
[ ]:
# calculate crossover errors
survey.calculate_crossover_errors(data_col="grav_disturbance_filt")
inters = survey.intersections
inters.head()
[6]:
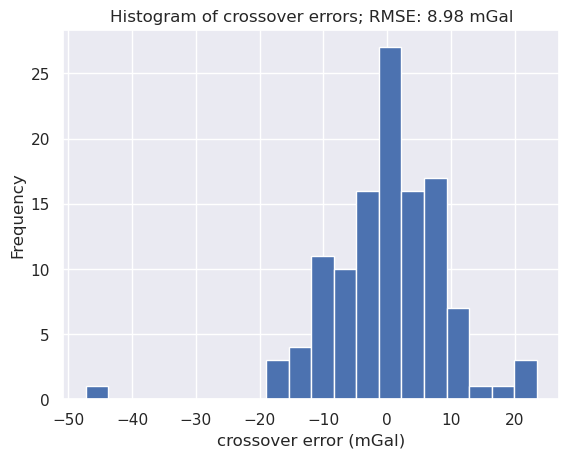
ax = inters[inters.columns[-1]].plot.hist(bins=20)
ax.set_xlabel("crossover error (mGal)")
ax.set_title(
    f"Histogram of crossover errors; RMSE: {round(airbornegeo.rmse(inters[inters.columns[-1]]), 2)} mGal"
);
[7]:
ax = data_df.plot.scatter(
    "easting",
    "northing",
    color="k",
    s=1,
    lw=0,
    marker=",",
    alpha=0.1,
)
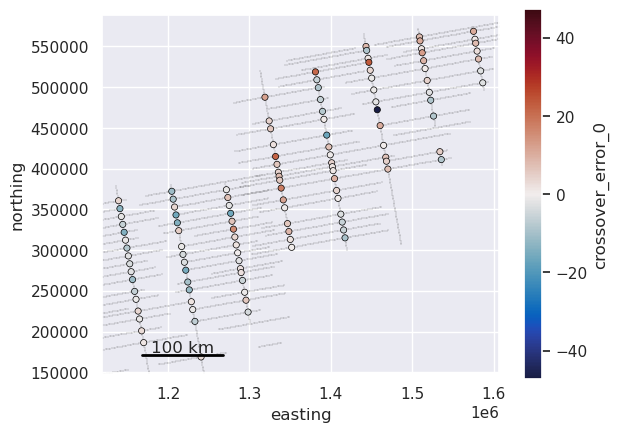
maxabs = vd.maxabs(inters[inters.columns[-1]])
inters.plot.scatter(
    "easting",
    "northing",
    c=inters.columns[-1],
    s=20,
    marker="o",
    cmap=cmocean.cm.balance,
    ax=ax,
    vmin=-maxabs,
    vmax=maxabs,
    linewidth=0.5,
    edgecolor="black",
)
# zoom into region with intersections
reg = vd.get_region((inters.easting, inters.northing))
reg = vd.pad_region(reg, 20e3)
ax.set_xlim(reg[0], reg[1])
ax.set_ylim(reg[2], reg[3])

airbornegeo.add_scalebar(ax, 100e3)
ax.set_aspect("equal")
Inspect flight altitudes#
[ ]:
ax = survey.plot(color_by="height", s=1)
airbornegeo.add_scalebar(ax, 100e3)
Interpolate flight heights at intersection points#
[ ]:
# interpolate height values at intersection
survey.interpolate_intersections(
    to_interp="height",
    window_width=500,
    method="cubic",
    extrapolate=True,
)

# add heights to intersections table
survey.add_values_to_intersections(
    columns=["height"],
)

# calculate cross-over height differences
inters = survey.intersections
inters["inter_height_diff"] = np.abs(inters["line1_height"] - inters["line2_height"])
inters.head()
[10]:
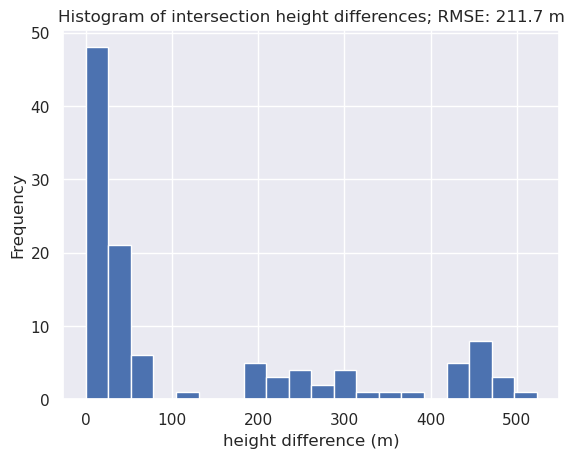
ax = inters.inter_height_diff.plot.hist(bins=20)
ax.set_xlabel("height difference (m)")
ax.set_title(
    f"Histogram of intersection height differences; RMSE: {round(airbornegeo.rmse(inters.inter_height_diff), 2)} m"
);
[11]:
ax = data_df.plot.scatter(
    "easting",
    "northing",
    color="k",
    s=1,
    lw=0,
    marker=",",
    alpha=0.1,
)

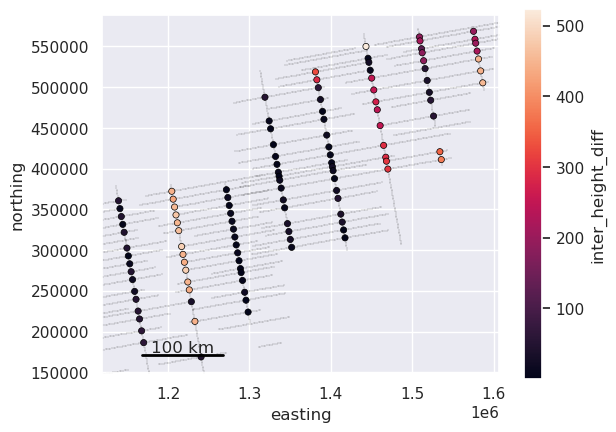
inters.plot.scatter(
    "easting",
    "northing",
    c="inter_height_diff",
    s=20,
    marker="o",
    ax=ax,
    linewidth=0.5,
    edgecolor="black",
)
# zoom into region with intersections
reg = vd.get_region((inters.easting, inters.northing))
reg = vd.pad_region(reg, 20e3)
ax.set_xlim(reg[0], reg[1])
ax.set_ylim(reg[2], reg[3])

airbornegeo.add_scalebar(ax, 100e3)
ax.set_aspect("equal")
[12]:
# see the 5 intersections with the largest height difference
inters.sort_values("inter_height_diff", ascending=False)[
    ["line1", "line2", "inter_height_diff"]
].head()
[12]:
| line1 | line2 | inter_height_diff | |
|---|---|---|---|
| 52 | 42 | 96 | 523.00 |
| 22 | 18 | 88 | 485.45 |
| 31 | 24 | 88 | 482.75 |
| 10 | 10 | 88 | 473.20 |
| 16 | 14 | 88 | 463.60 |
[13]:
airbornegeo.plot_line_and_crosses(
    data_df,
    line=88,
    x="distance_along_line",
    y=["height", "grav_disturbance_filt"],
    y_axes=[1, 2],
    plot_inters=True,
    line_column="line",
)
From the above plot showing line 88, we can see many of the intersecting lines were flown ~400 m lower in altitude. This is shown be the vertical offset between the blue diamonds and blue points.
Fit equivalent sources to each line#
Generate a set of fitted equivalent sources for each flight line, excluding the intersection data points.
[ ]:
fitted_sources = survey.eq_sources_1d(
    data_column="grav_disturbance_filt",
    depth="default",
    damping=0.01,
    block_size=500,
)
Upward continue the intersection points to common altitudes#
For each intersection point, we find the highest of the two flight elevations, and upward continue the lower data point to this height. This only changes the individual intersection point, not any of the rest of the line. You can see in the below profile of line 148 that the line data is the same between mag and the new column mag_eqs, but if you look at the intersection points (diamonds), you will see some of the have shifted slightly.
[ ]:
survey.update_intersections_with_eq_sources(
    fitted_equivalent_sources=fitted_sources,
    data_column="grav_disturbance_filt",
    result_column="grav_eqs",
)
[17]:
airbornegeo.plot_line_and_crosses(
    data_df,
    line=88,
    x="distance_along_line",
    y=["height", "grav_disturbance_filt", "grav_eqs"],
    y_axes=[1, 2, 2],
    plot_inters=[True, True, True],
    line_column="line",
)
Recalculate cross-over errors with the updated intersection values#
[ ]:
survey.calculate_crossover_errors(data_col="grav_eqs")
inters = survey.intersections
inters
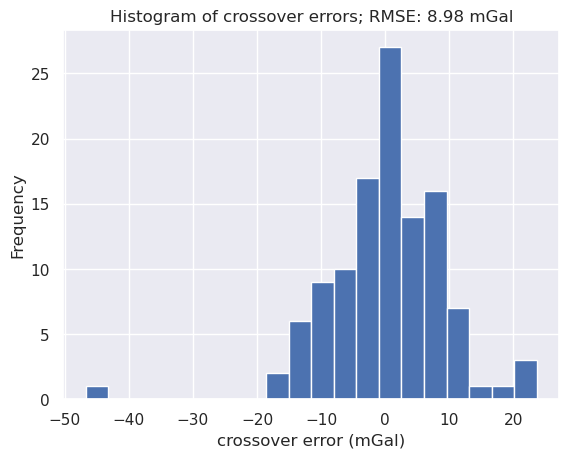
[19]:
ax = inters[inters.columns[-1]].plot.hist(bins=20)
ax.set_xlabel("crossover error (mGal)")
ax.set_title(
    f"Histogram of crossover errors; RMSE: {round(airbornegeo.rmse(inters[inters.columns[-1]]), 2)} mGal"
);
[ ]:
airbornegeo.plot_levelling_convergence(inters)
[ ]:
fig, axs = plt.subplots(2, 1, figsize=(20, 10))

cpt_lims = vd.minmax(inters.inter_height_diff, min_percentile=10, max_percentile=98)
ax = inters.plot.scatter(
    "easting",
    "northing",
    c="inter_height_diff",
    s=10,
    ax=axs[0],
    cmap="viridis_r",
    vmin=cpt_lims[0],
    vmax=cpt_lims[1],
    colorbar=False,
    title="Cross-over height differences",
)
ax.set_aspect("equal")
plt.colorbar(ax.collections[0], label="height difference (m)", ax=ax, shrink=0.8)

inters["crossover_error_dif"] = np.abs(
    inters.crossover_error_1 - inters.crossover_error_0
)
cpt_lims = vd.minmax(inters.crossover_error_dif, min_percentile=10, max_percentile=98)
ax = inters.plot.scatter(
    "easting",
    "northing",
    c="crossover_error_dif",
    s=10,
    ax=axs[1],
    cmap="viridis_r",
    vmin=cpt_lims[0],
    vmax=cpt_lims[1],
    colorbar=False,
    title="Cross-over gravity difference before/after upward continuation",
)
ax.set_aspect("equal")
plt.colorbar(
    ax.collections[0], label="cross-over error difference (mGal)", ax=ax, shrink=0.8
)

plt.tight_layout()
We can see that by just upward continuing the intersection points, we have slightly lowered the cross-over errors.