7. Alternating iterative tie line levelling#
[1]:
%load_ext autoreload
%autoreload 2
import logging
import geopandas as gpd
import pandas as pd
import plotly.io as pio
import airbornegeo
logging.getLogger("airbornegeo").setLevel("INFO")
logging.basicConfig()
pio.renderers.default = "notebook"
/home/airbornegeo/airbornegeo/.pixi/envs/default/lib/python3.14/site-packages/tqdm/auto.py:21: TqdmWarning: IProgress not found. Please update jupyter and ipywidgets. See https://ipywidgets.readthedocs.io/en/stable/user_install.html
from .autonotebook import tqdm as notebook_tqdm
7.1. Load data#
This is a subset of the BAS AGAP survey over Antarctica’s Gamburtsev Subglacial Mountains. The file is download and subset in the notebook AGAP_magnetic_survey, and the BAS processing steps are repeated in the notebook processing_AGAP_magnetic_survey.
[2]:
data_df = pd.read_csv("data/AGAP_magnetic_survey_processed_blocked.csv")
data_df = data_df[
[
"easting",
"northing",
"height",
"line",
"unixtime",
"distance_along_line",
"mag",
]
]
# for testing limit number of lines
data_df = data_df[~data_df.line.between(133, 142)]
data_df = data_df[~data_df.line.between(168, 176)]
data_df = data_df[
(data_df.line.isin(data_df.line.unique()[::2])) | (data_df.line >= 143)
]
# define flight lines vs tie lines with column 'tie' which is True or False
data_df["tie"] = False
data_df.loc[data_df.line >= 142, "tie"] = True
data_df.head()
[2]:
| easting | northing | height | line | unixtime | distance_along_line | mag | tie | |
|---|---|---|---|---|---|---|---|---|
| 0 | 621099.093988 | 159056.748193 | 4110.45 | 1 | 1.229500e+09 | 27.181565 | -33.385 | False |
| 1 | 621206.517953 | 159071.301512 | 4114.50 | 1 | 1.229500e+09 | 135.587530 | -35.120 | False |
| 2 | 621313.794221 | 159085.113599 | 4117.90 | 1 | 1.229500e+09 | 243.749367 | -36.875 | False |
| 3 | 621420.722903 | 159099.184618 | 4120.80 | 1 | 1.229500e+09 | 351.600337 | -38.585 | False |
| 4 | 621527.158177 | 159114.303863 | 4123.15 | 1 | 1.229500e+09 | 459.104857 | -40.205 | False |
7.2. Find intersections#
[3]:
# convert dataframe into geodataframe
data_df = gpd.GeoDataFrame(
data_df,
geometry=gpd.points_from_xy(data_df.easting, data_df.northing),
crs="EPSG:3031",
)
[4]:
# calculate theoretical intersection points
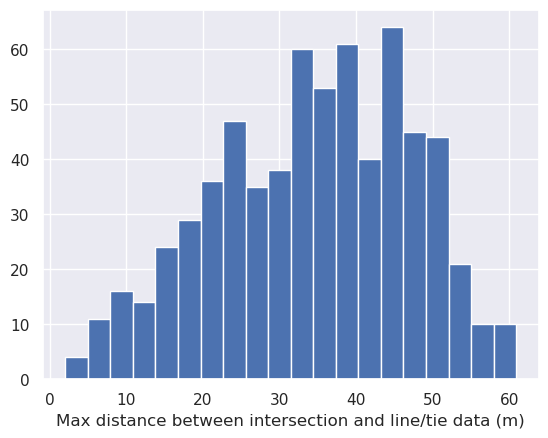
inters = airbornegeo.create_intersection_table(data_df)
inters
Line/tie combinations: 100%|██████████| 3630/3630 [00:00<00:00, 7629.54it/s]
Potential intersections: 100%|██████████| 670/670 [00:06<00:00, 110.66it/s]
INFO:airbornegeo:found 662 intersections
[4]:
| line | tie | geometry | max_dist | easting | northing | |
|---|---|---|---|---|---|---|
| 0 | 1 | 143 | POINT (1158153 254083) | 16.441255 | 1158153.0 | 254083.0 |
| 1 | 1 | 144 | POINT (1190820 259865) | 24.124887 | 1190820.0 | 259865.0 |
| 2 | 1 | 145 | POINT (1223524 265689) | 17.269650 | 1223524.0 | 265689.0 |
| 3 | 1 | 146 | POINT (1256193 271497) | 31.608179 | 1256193.0 | 271497.0 |
| 4 | 1 | 147 | POINT (1288901 277249) | 50.174377 | 1288901.0 | 277249.0 |
| ... | ... | ... | ... | ... | ... | ... |
| 657 | 125 | 199 | POINT (1318165 302398) | 33.689493 | 1318165.0 | 302398.0 |
| 658 | 125 | 200 | POINT (1350929 308239) | 36.343660 | 1350929.0 | 308239.0 |
| 659 | 127 | 148 | POINT (1319894 292699) | 22.093103 | 1319894.0 | 292699.0 |
| 660 | 127 | 199 | POINT (1319922 292702) | 23.297236 | 1319922.0 | 292702.0 |
| 661 | 127 | 200 | POINT (1352642 298507) | 36.743873 | 1352642.0 | 298507.0 |
662 rows × 6 columns
7.3. Add intersections as rows to the dataframe#
[5]:
data_df, inters = airbornegeo.interpolate_intersections(
data_df,
inters,
to_interp=["mag", "height"],
window_width=500,
method="cubic",
extrapolate=False,
)
Line 206: 100%|██████████| 121/121 [00:22<00:00, 5.28it/s]
[6]:
airbornegeo.lines_without_intersections(data_df, inters)
[6]:
[np.int64(107),
np.int64(109),
np.int64(129),
np.int64(131),
np.int64(188),
np.int64(189),
np.int64(190),
np.int64(192),
np.int64(193),
np.int64(194),
np.int64(203)]
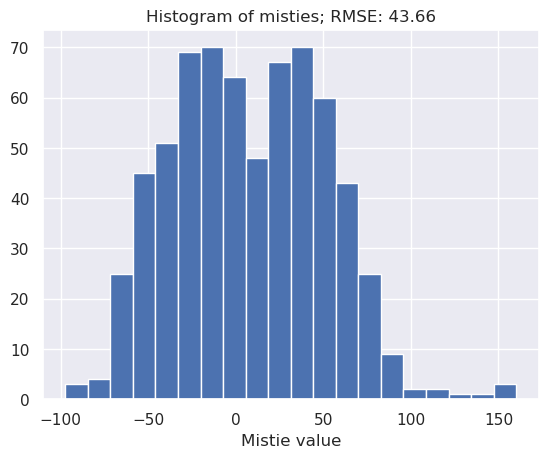
7.4. Calculate initial cross-over errors#
[7]:
inters = airbornegeo.calculate_crossover_errors(
data_df,
inters,
data_col="mag",
plot_map=True,
)
[8]:
inters.head()
[8]:
| line | tie | geometry | max_dist | easting | northing | dist_along_flight_line | dist_along_flight_tie | flight_interpolation_type | tie_interpolation_type | flight_height | tie_height | mistie_0 | |
|---|---|---|---|---|---|---|---|---|---|---|---|---|---|
| 0 | 1 | 143 | POINT (1158153 254083) | 16.441255 | 1158153.0 | 254083.0 | 545768.072695 | 138071.419338 | interpolated | interpolated | 4168.038983 | 4008.397691 | 100.458661 |
| 1 | 1 | 144 | POINT (1190820 259865) | 24.124887 | 1190820.0 | 259865.0 | 578952.394781 | 131585.125284 | interpolated | interpolated | 4174.500813 | 4010.840823 | 32.151483 |
| 2 | 1 | 145 | POINT (1223524 265689) | 17.269650 | 1223524.0 | 265689.0 | 612181.972720 | 147253.496664 | interpolated | interpolated | 3544.149925 | 3995.961216 | 72.936553 |
| 3 | 1 | 146 | POINT (1256193 271497) | 31.608179 | 1256193.0 | 271497.0 | 645372.035087 | 136211.666619 | interpolated | interpolated | 3564.579994 | 3578.174277 | 84.125118 |
| 4 | 1 | 147 | POINT (1288901 277249) | 50.174377 | 1288901.0 | 277249.0 | 678598.170740 | 155115.224990 | interpolated | interpolated | 3536.160719 | 3545.947314 | -7.731396 |
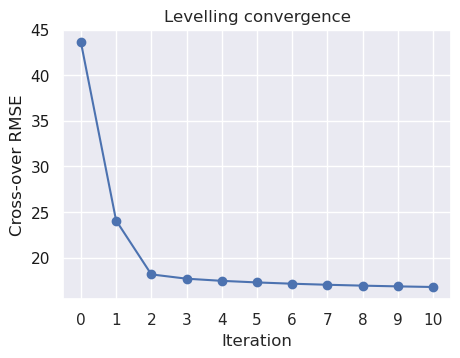
7.5. Alternative between levelling lines to ties, and ties to lines#
This will perform up to 5 iterations where each iteration first levels the lines to the ties, then the ties to the lines. Since each iteation performs two instances of leveling, there will be up to 10 new misties columns in the intersection table. If the misties values dont decrease, or begin increasing, the iterations will stop.
[9]:
data_df, inters = airbornegeo.alternating_iterative_line_levelling(
data_df,
inters,
data_col="mag",
levelled_col="mag_levelled_trend0",
degree=0,
iterations=5,
)
inters.head()
Iteration: 100%|██████████| 5/5 [01:06<00:00, 13.24s/it]
[9]:
| line | tie | geometry | max_dist | easting | northing | dist_along_flight_line | dist_along_flight_tie | flight_interpolation_type | tie_interpolation_type | ... | mistie_1 | mistie_2 | mistie_3 | mistie_4 | mistie_5 | mistie_6 | mistie_7 | mistie_8 | mistie_9 | mistie_10 | |
|---|---|---|---|---|---|---|---|---|---|---|---|---|---|---|---|---|---|---|---|---|---|
| 0 | 1 | 143 | POINT (1158153 254083) | 16.441255 | 1158153.0 | 254083.0 | 545768.072695 | 138071.419338 | interpolated | interpolated | ... | 96.945621 | 72.958517 | 71.904752 | 67.038524 | 67.150418 | 63.393096 | 63.723800 | 60.721570 | 61.069625 | 58.628182 |
| 1 | 1 | 144 | POINT (1190820 259865) | 24.124887 | 1190820.0 | 259865.0 | 578952.394781 | 131585.125284 | interpolated | interpolated | ... | 28.638444 | 19.088634 | 18.034870 | 13.168642 | 13.280535 | 9.523214 | 9.853917 | 6.851688 | 7.199742 | 4.758299 |
| 2 | 1 | 145 | POINT (1223524 265689) | 17.269650 | 1223524.0 | 265689.0 | 612181.972720 | 147253.496664 | interpolated | interpolated | ... | 69.423514 | 49.368210 | 48.314446 | 43.448218 | 43.560111 | 39.802790 | 40.133493 | 37.131264 | 37.479318 | 35.037876 |
| 3 | 1 | 146 | POINT (1256193 271497) | 31.608179 | 1256193.0 | 271497.0 | 645372.035087 | 136211.666619 | interpolated | interpolated | ... | 80.612078 | 60.446633 | 59.392868 | 54.526640 | 54.638534 | 50.881212 | 51.211916 | 48.209686 | 48.557741 | 46.116298 |
| 4 | 1 | 147 | POINT (1288901 277249) | 50.174377 | 1288901.0 | 277249.0 | 678598.170740 | 155115.224990 | interpolated | interpolated | ... | -11.244436 | -2.791611 | -3.845375 | -8.711603 | -8.599710 | -12.357032 | -12.026328 | -15.028558 | -14.680503 | -17.121946 |
5 rows × 23 columns
[10]:
airbornegeo.plot_levelling_convergence(inters)
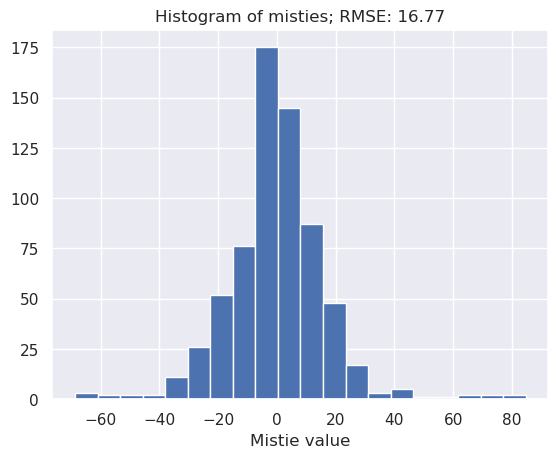
[11]:
inters = airbornegeo.calculate_crossover_errors(
data_df,
inters,
data_col="mag_levelled_trend0",
plot_map=True,
)
[12]:
airbornegeo.plotly_points(
data_df[::10],
color_col="mag_levelled_trend0",
)